The Synaptic Physiology Dataset was generated with a standardized, large-scale approach using in vitro multipatch electrophysiology. This allowed us to explore connectivity among a diverse set of neuronal subclasses. Below is a workflow describing how this dataset was acquired; more detailed information can be found in our publications Seeman, Campagnola et al. 2018 and Campagnola, Seeman et al. 2022. Once data was collected it was processed through our Analysis Workflow.
Cell class targeting
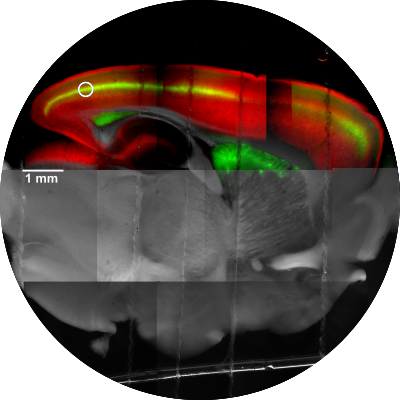
Cre-/FlpO- transgenic breeding drove fluorescent reporter expression in two cell subclasses within the same mouse enabling targeted recording between them. Human excitatory cells were identified by morphology and cortical depth.
Slices from adult (P40-P60) mouse primary visual cortex or human (18-75 years) frontotemporal cortex were prepared and held in artificial cerebrospinal fluid (aCSF) warmed to 32oC. The aCSF typically contained physiological levels (1.3 mM) of calcium.
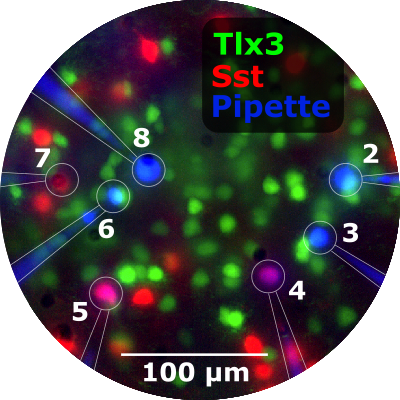
Octopatching
In each slice, up to eight neurons were recorded simultaneously, allowing for probing of up to 56 potential synaptic connections. Cells were recorded in voltage and current clamp mode at two holding potentials to identify excitatory and inhibitory connections.
Experimental protocol
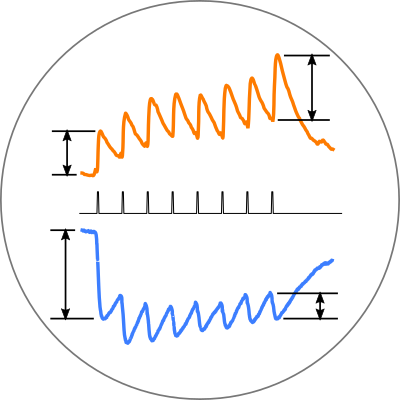
A variety of stimuli were delivered to each recorded cell in turn to characterize the strength, kinetics, and short-term plasticity of identified synapses. Synaptic stimuli consisted of trains of eight pulses at frequencies ranging from 10 - 200 Hz, followed by four pulses with a variable delay. Additional stimuli were delivered to measure intrinsic cell features.
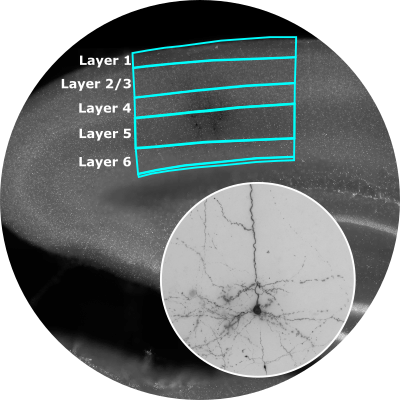
Recorded cells were filled with biocytin, and slices were fixed and stained. Layer boundaries were identified from DAPI staining. Biocytin-filled cells received an annotated layer as well as general morphologic characterization, including spiny-ness and axon and dendrite length.
Synaptic Physiology Analysis Methods Quality Control
Learn about Synaptic Physiology Analysis Methods Quality Control with comprehensive guides and examples from Allen Institute for Brain Science.
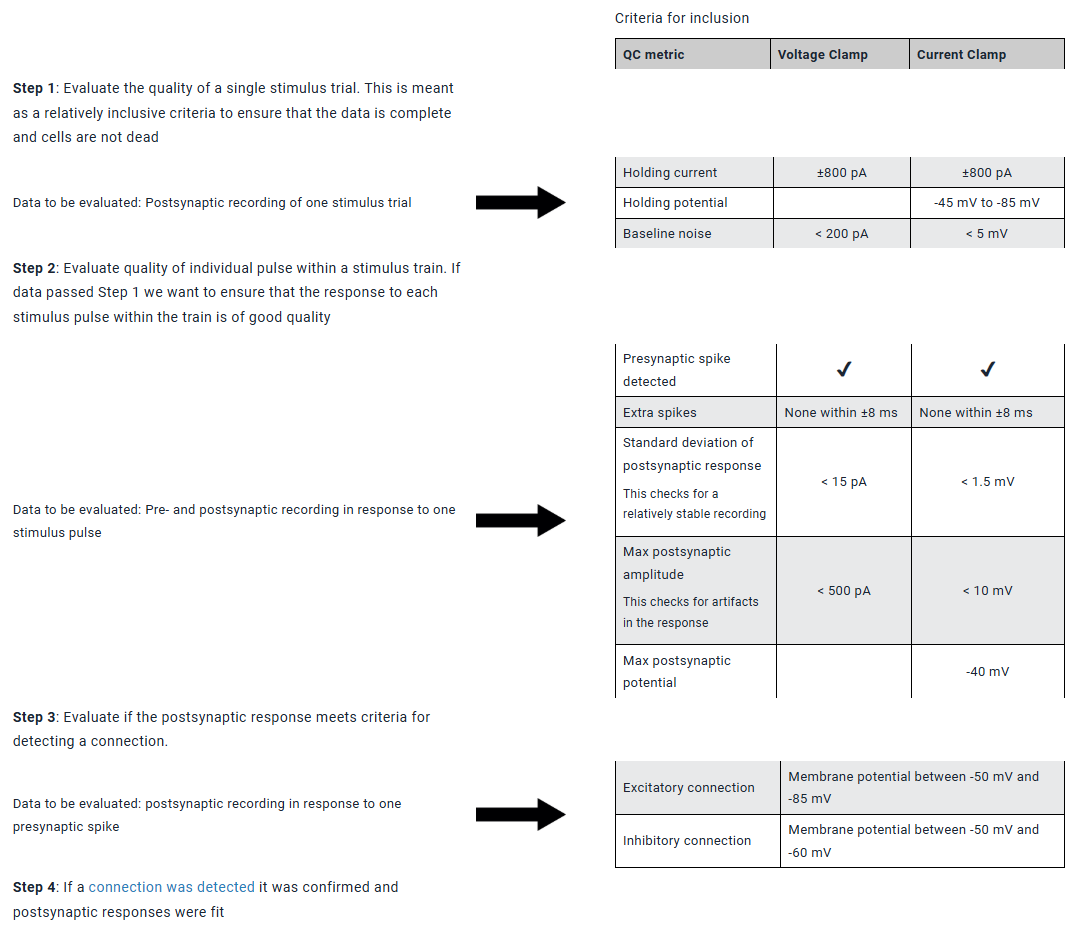
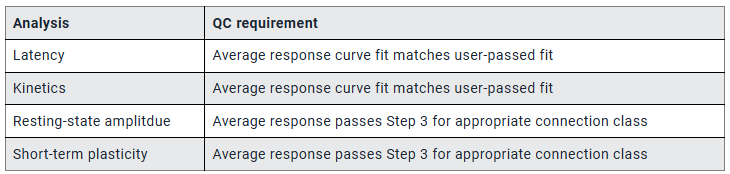
Ensuring the quality of the Synaptic Physiology Dataset is of critical importance. We applied quality control criteria at several stages of data processing and analysis. During the processing stages, in order for data to proceed into successive stages it had to pass quality control for the prior stage. During analysis of connection properties, each analysis (e.g., strength, kinetics, short-term plasticity) had independent quality control metrics. Below is a workflow of the quality control metrics required for inclusion at each stage of processing and analysis.
Data Processing
Data was first processed to ensure that it was of good enough quality to detect a connection
Data analysis
During characterization of a synapse, different QC criteria were applied based on the metric that was being analyzed.
Learn about Synaptic Physiology Analysis Methods Connection Characterization with comprehensive guides and examples from Allen Institute for Brain Science.
Chemical connections were detected manually, curve fit, and then characterized for strength, kinetics, and short-term plasticity in a multi-stage process. Manual connectivity calls were used to train a machine classifier (see Seeman, Campagnola, et al. 2018 for more detail). After training, the machine classifier revealed a set of potential false positives or false negatives that were manually re-checked. Electrical connections were also detected and characterized.
Connection Detection
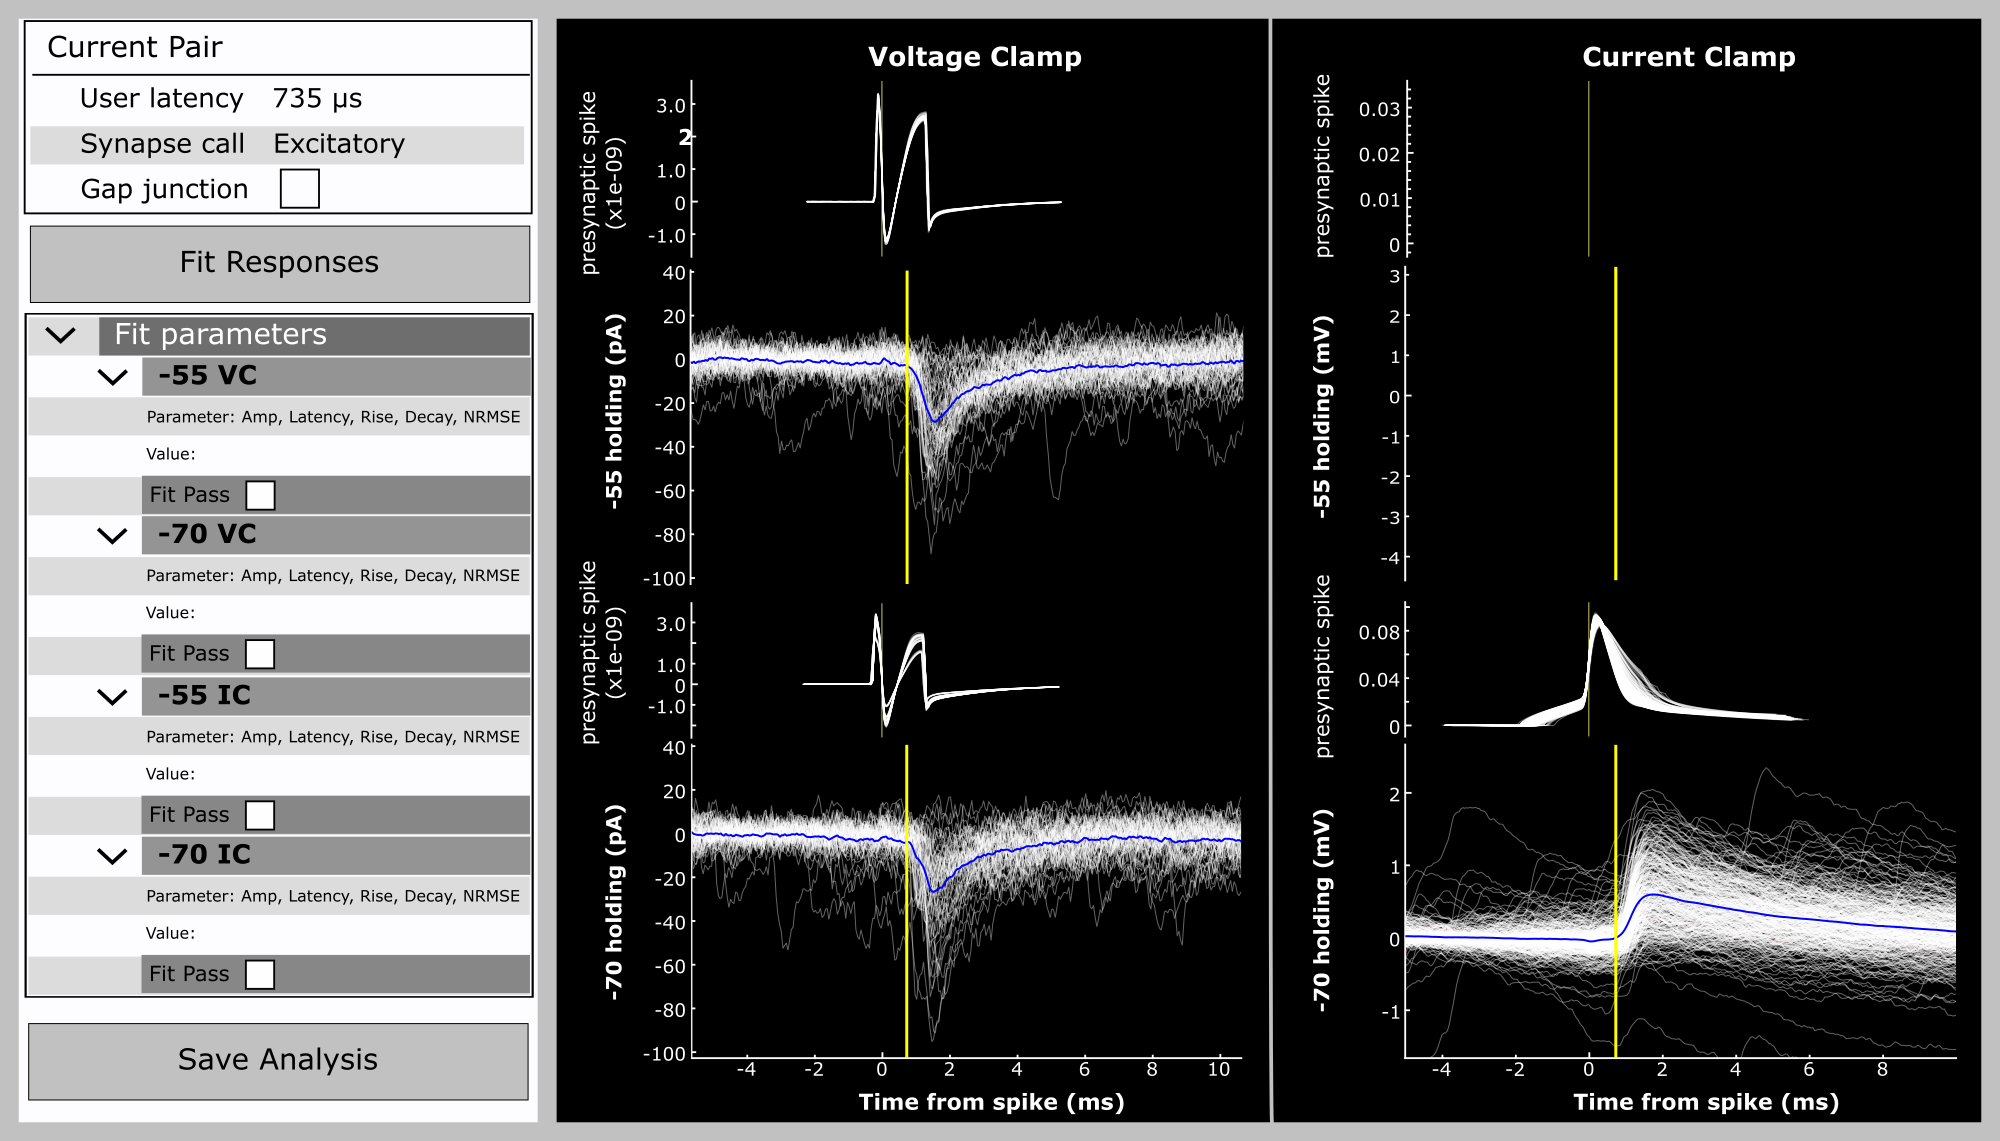
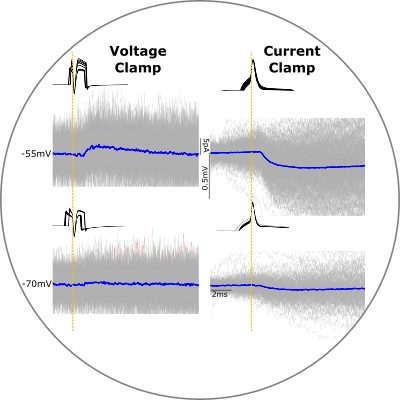
Chemical connections were visually identified from average postsynaptic responses sorted by recording mode (voltage and current clamp) and membrane potential (see QC criteria for holding potential ranges for excitatory and inhibitory connections). Individual responses were time aligned to the presynaptic spike. Responses that failed QC were not included in the average.
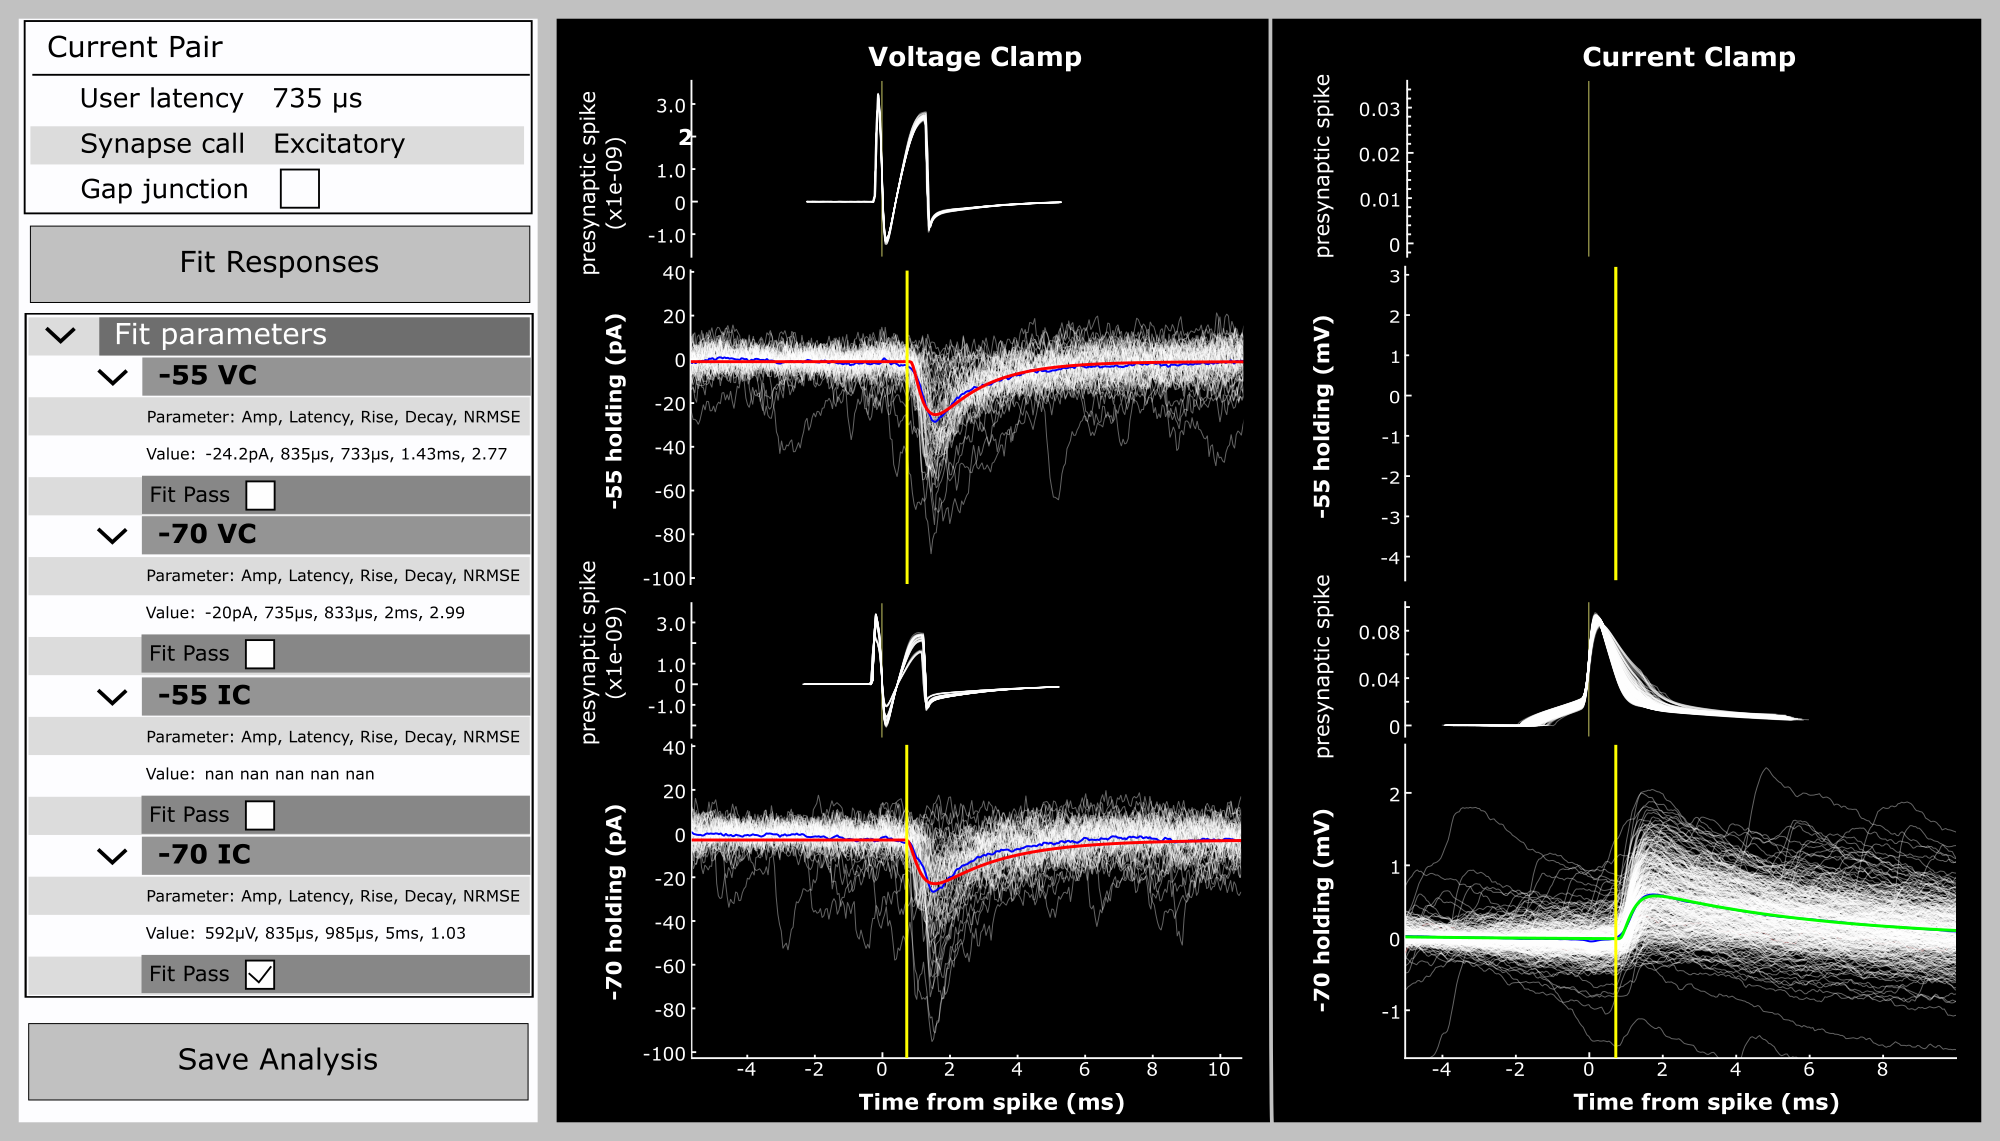
Users could visualize connections sorted by recording mode and membrane potential, then move the yellow line to set the onset of the response. The Fit Response button would then generate a fit constrained to ± 100 µs of the user-defined latency.
The User Latency value was used to initialize automated curve fitting of the postsynaptic response. Parameters from the curve fits were shown for each quadrant. When the user was satisfied with the curve fitting output, the goodness of fit was manually passed or failed. The user would take into consideration gap junctions, electrical artifacts, the shape of the fit or other factors when deciding whether the curve fit accurately reflected the response. Notes were also made by the user and used to update, and subsequently test, new fitting algorithms.
In this example, the voltage clamp fits were failed because they could not accurately capture the shape of the response, while the current clamp response was a good fit and passed. No data was collected at depolarized potentials in current clamp and thus is ignored
Connection Characterization
Once a chemical connection was identified, the strength and kinetics of that connection, as well as the dynamics (short-term plasticity (STP) and variability), were characterized utilizing the curve fits generated during connection detection.
Strength and Kinetics
The "strength" of a connection is an important characteristic particularly when we want to start comparing connections across cell class. However, we know that strength changes dynamically over time (as is highlighted in our analysis of STP) as well as stochastically from spike to spike. Given that our stimulus set utilizes trains of various frequencies we want to ensure that our metric of strength would be useful in comparisons across connections and not be stimulus dependent. Our resting-state strength is a metric that works well for most connections; however, some facilitating connections have a very small resting-state strength which may be misleading. Rise and decay kinetics are more faithfully preserved even as the amplitude of the connection changes and thus, was more straightforward to characterize.
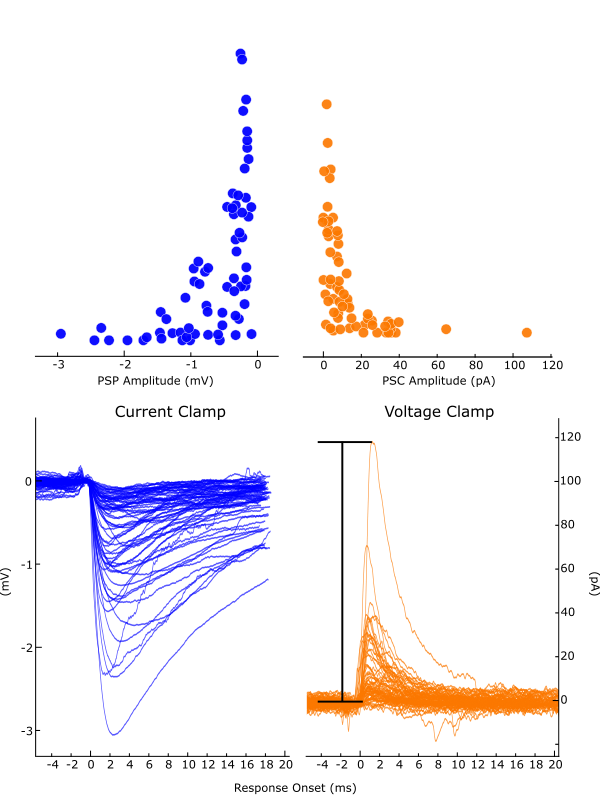
Resting-state amplitude was determined from responses in which the presynaptic spike follows a period of quiescence. Usually this is the first pulse in each stimulus train. Individual responses were averaged and curve fit; the amplitude output of the fit served as our metric of strength.
Type image caption here (optional)Average resting-state responses in current and voltage clamp. Each trace is the resting state average PSP/C from a single connection. Traces were fit and the fit amplitude is plotted above.
Latency, rise and decay kinetics were also determined from curve fits to average synaptic responses. Kinetics were calculated for postsynaptic currents (PSCs) and potentials (PSPs) held at either -70 or -55 mV depending on whether the synapse was excitatory or inhibitory (see QC requirement).
Short-term plasticity
Short-term plasticity was analyzed from data recorded in current clamp utilizing different stimuli depending on the analysis. We measured three main metrics of short-term plasticity: paired-pulse ratio (PPR), train-induced STP, and recovery from train-induced STP.
Short-term plasticity is often calculated as a ratio of response amplitudes for each pulse in the stimulus train. Many connections in our dataset have small responses that are close to the noise level in our recordings making the use of an amplitude ratio unstable. This situation is accentuated for connections that are strongly depressing or facilitating resulting in spurious ratio measurements. To avoid this instability, we use the 90th percentile PSP amplitude as an approximation of the "maximum" amplitude of a synapse and normalize our STP measurements by this value. Below are the calculations for each STP metric.
Paired-pulse STP was measured from the 50Hz stimulus as:
Recovery from STP was measured from all stimulus frequencies with a 250 ms delay between the last induction pulse (8th) and first recovery pulse (9th):
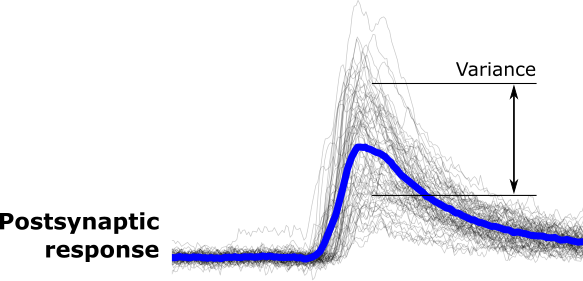
The amplitude of PSPs for a synaptic connection vary randomly each time neurotransmitter is released. This is often reported using the coefficient of variation (CV). In the mouse cortex, however, typical PSP amplitudes can be much smaller than the background electrical noise in the cell. CV in this regime is thus dominated by noise and tells us little about the physiology of the synaptic connections. In our dataset, PSP amplitude variability is reported using a metric that is adjusted (aCV) to correct for the effect of background noise:
This metric has a value of 1.0 when the standard deviation of the PSP amplitudes (after noise correction) is the same as the median amplitude. The noise correction itself introduces a new source of variance, however, which can sometimes lead to this value being negative. We measure variability in the resting state for each connection as well as in various states of induced short-term plasticity.
Variability in postsynaptic response amplitude from trial-to-trial (black traces) with average (blue) response
Synaptic Vesicle Release Model
We developed a new model of synaptic vesicle release that provides a more comprehensive description of each synaptic connection and also allows to predict the behavior of the synapse in response to arbitrary stimuli. The model includes basic quantal release parameters (release probability, number of release sites, and quantal size) as well as short term plasticity (vesicle depletion, depression, and facilitation with varying recovery time constants) and accounts for recording noise.
Our dataset includes best fit parameters (using a maximum likelihood estimation) of the model for many connections that can be used to simulate different types of connections, or as a basis for comparison between connection types.
Electrical Connections
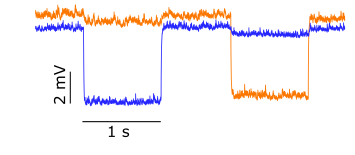
Electrical connections, formed by gap junctions, were also detected in our dataset. We used the long-pulse stimuli to characterize the strength of electrical connections.
Learn about Synaptic Physiology Analysis Methods with comprehensive guides and examples from Allen Institute for Brain Science.
Data generated during the experiment were analyzed in stages to identify and characterize connections between distinct cell subclasses. Below is a workflow describing how this dataset was processed and analyzed; more detail can be found in Seeman, Campagnola et al. 2018 and Campagnola, Seeman et al. 2022.
Cell classification
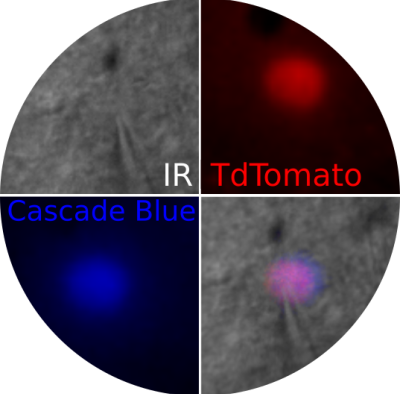
Transgenic cell subclass was identified from the overlap of the fluorescent reporter of the cell and that of the recording pipette. Spiny and aspiny cells were defined from morphological analysis. Cells were annotated with a target layer during the experiment, and later a corrected layer determined from biocytin and DAPI staining.
Connections were identified from manual inspection of the postsynaptic response aligned to the presynaptic spike. Excitatory and inhibitory connections could be observed in both voltage and current clamp at a holding potential that increased the driving force for each connection class. Weak connections were detectable by averaging hundreds of postsynaptic responses.