Data Catalog User Guide
Text search
The Data Catalog’s text search empowers scientists to search for relevant resources with their own search terms. Access the Data Catalog’s text search field at https://knowledge.brain-map.org/data
- Type in your search term
OPTIONAL: Use AND or OR operators to further refine relationships between keywords, e.g. “cortex AND mouse” - Hit enter or the loupe icon to trigger the search
- The search results load
- Clear the text search by clicking the X icon and repeat
Text search complements the faceted search interface - see more details below.
Scientists can use both for complementary search approaches:
- Run a general text search, then refine the results via faceted search.
- Constraint the search space via faceted search, then run a text search to go deeper.
Faceted search
Set filters
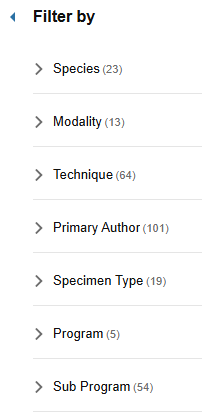
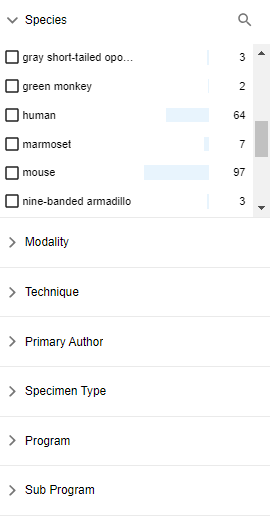
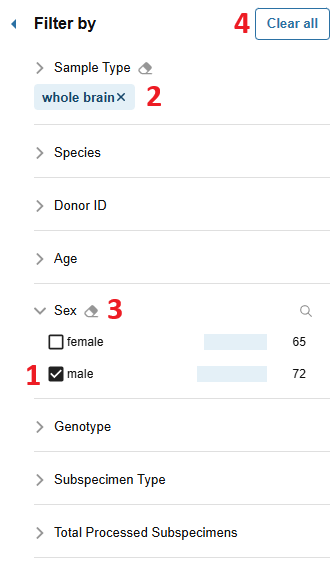
Scientists can filter for relevant projects across species, modality, technique, primary author, specimen type, program, and sub program.
Click on the check box to apply a filter. The bars & numbers indicate the number of relevant result, e.g. 97 projects for species mouse. Numbers update relative to the selected filters.
Clear filters
Scientists can clear
- individual filters by unchecking the checkbox in the extended section view
- clicking X on the filters chips in collapsed sections
- all filters in a specific section by clicking the eraser button
- all filter via the Clear all button
Browse Data Catalog
Program details pages
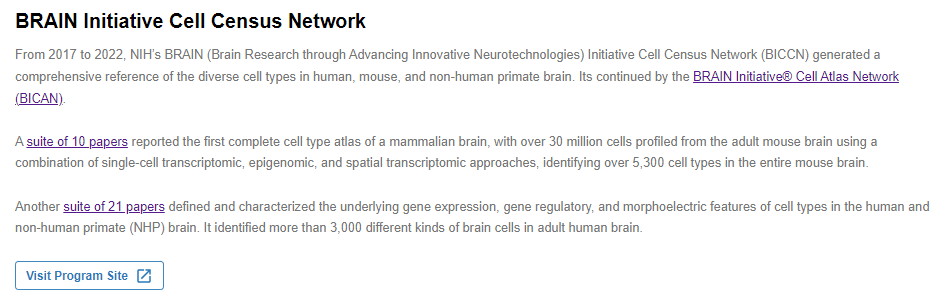
Large scientific consortia, e.g. NIH’s BRAIN Initiative Cell Census Network (BICCN) or BRAIN Initiative® Cell Atlas Network (BICAN), are distributed across many contributing organizations and generate a lot of important data.
The program pages in the BKP’s Data Catalog enable scientists to get an overview of these consortia and their available data at a glance. Example include BICAN and BICCN program pages.
They feature a short text introduction to the program:
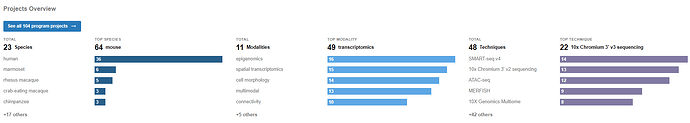
An interactive dashboard summarizing the available data. It allows scientists to access all projects from a given project in the BKP’s Data Catalog, e.g. 104 BICCN projects.

They can also click through to more granular search results, e.g. a search filtered to the 64 BICCN projects where the species is mouse.
Featured projects further highlight choice resources:
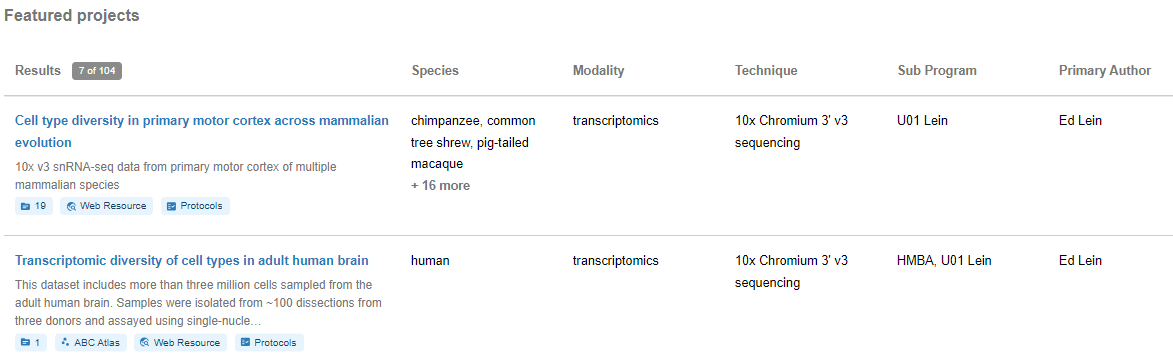
They feature core project metadata as well as preview indicators of data and resources associated with a given project:

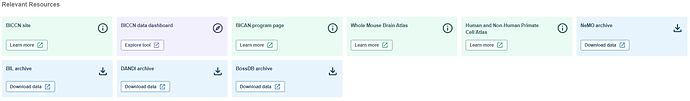
Lastly, they include references to various related resources. These include landing pages, tools, protocols, data archives, and more.
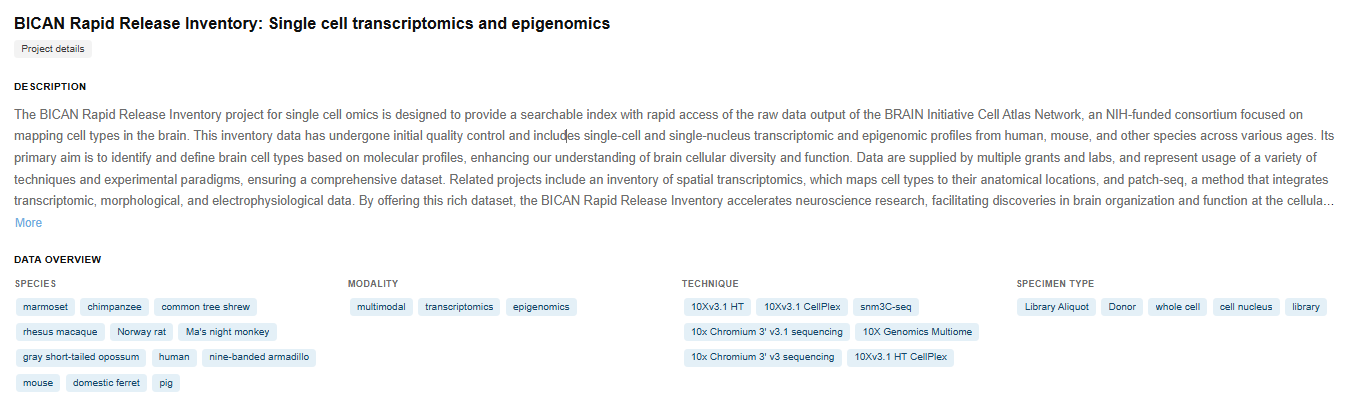
Project details page
Project description & data overview
The top of the project details page features a text description summarizing the project. It also features an overview of the species, modalities, techniques, and specimen types involved.
Other project metadata
A side panel offers additional project metadata, including detailed links to licenses, funding sources, and protocols.
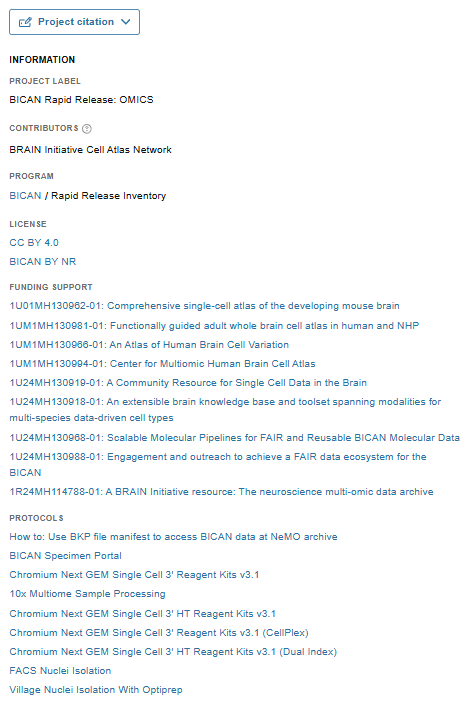
Note that if a project has both primary authors and general contributors, the primary authors are shown by default.

When the contributors are expanded, both primary author and general contributors are show.

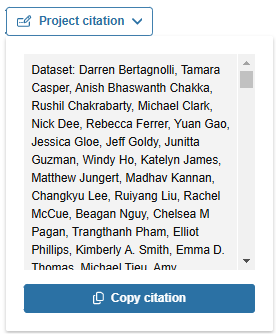
Citation button
Click the dropdown to view the citation.

Then click the “Copy citation” button to copy it to your clipboard.
Highlighted resources
Click the buttons to access the highlighted resources. Project related resources can include:
Data visualizations, e.g. via ABC Atlas

Specimen metadata tables & their file manifest
Links to access raw or processed data files:

Other related resources, e.g. documentation:
Data collections
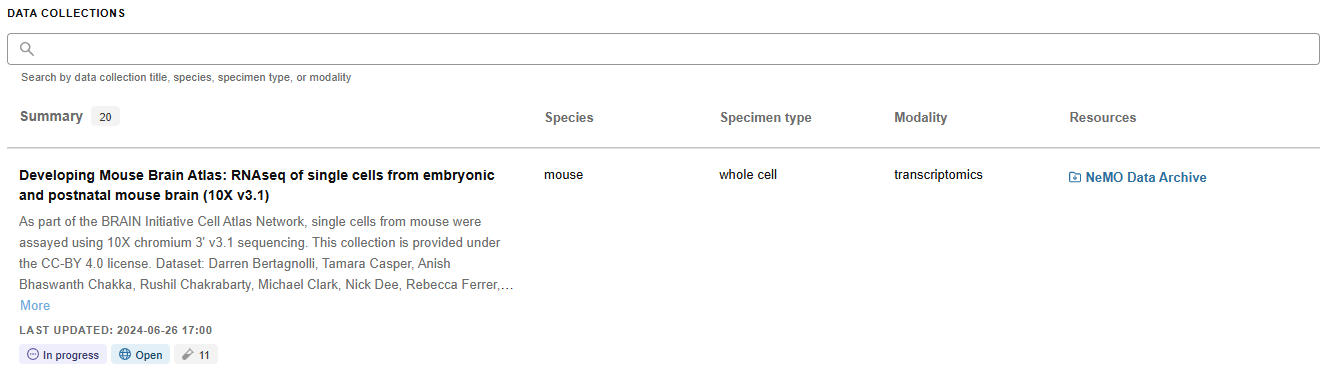
A project’s data collections are listed at the bottom of the project details page. Scientists can see the total number of available data collections (20 in the example screenshot) as well as collection metadata:
- Name & description
- Species
- Specimen type
- Modality
- Resources, e.g. a link to an archive to access the files
- Last updated timestamp
- Status, e.g. in progress vs completed
- Accessibility: e.g. open vs restricted
- Number of specimens in the collection
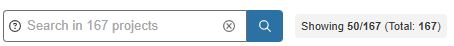
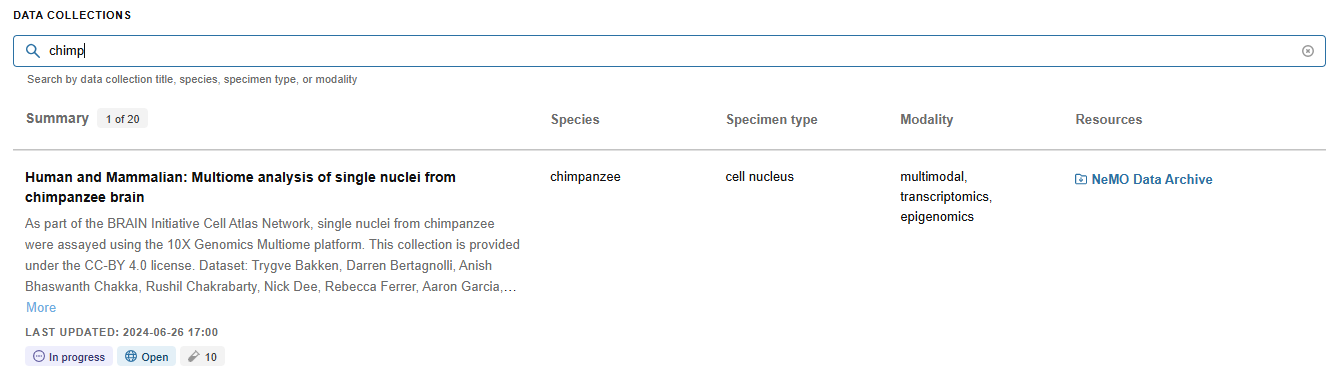
Scientist can text search across collection titles, species, specimen types, or modalities to find relevant collections quickly.
Note that when searching, the indicator changes to how many of the total collections match your query.
Remove the search by clicking the circled X in the search field.
Specimen details page
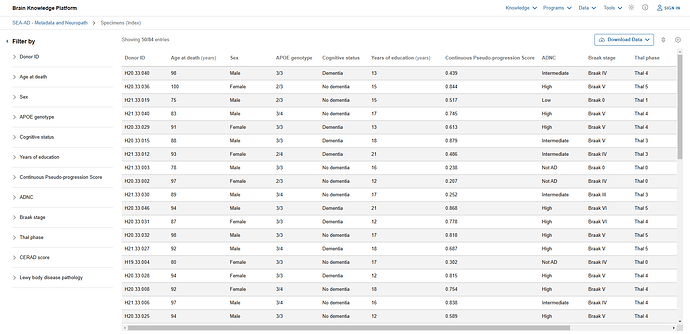
Specimen table view
The filter menu is displayed to the left of the results table. It’s width is adjustable.
Collapse the filter menu by clicking on the "<" button. Expand it by clicking on the ">" button. Expand the individual filter sections and apply them by checking the desired boxes.
Numbers and bar graph visuals illustrate the number of matching results.
Clear filters individually or by clicking the Clear all button. See the faceted search section above for more details.
Column headers feature improved help text and column widths can be adjusted more easily. Hovering over table rows provides visual feedback.
Display properties controls
Display property controls represent selected vs. available content.
Text search across the properties saves time spent scrolling and enables scientists to find the right property quickly.
Selected display properties are indicated by a check mark and bolt font.
Note: If you hide a column that you’re actively filtering on, those filters will be removed.

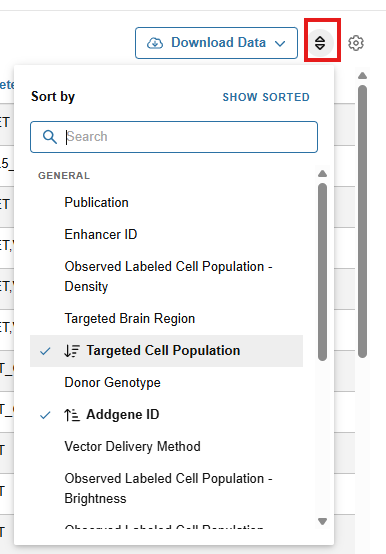
Sorting controls
Updated sorting controls more clearly represent selected vs. available options.
Text search across the properties saves time spent scrolling and enables scientists to find the right property quickly.
Selected sorting are indicated by bolt font. Icons represent ascending or descending order. Click on the icon to change sort order.
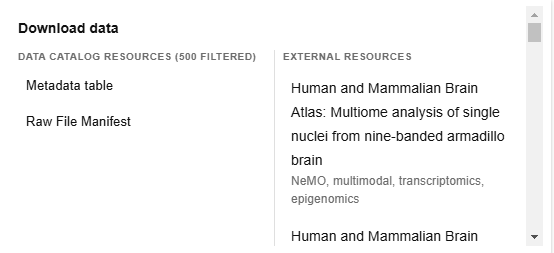
Metadata and file manifest download
Scientists can download metadata and file manifest for a set of specimen via a more prominent download button.

Metadata downloads match the filtered columns & rows in the UI. File manifest downloads match the specimen selection. Scientists can distinguish between downloads from Data Catalog and external archive resources in the popover:
Select individual rows for file manifest download
Projects that include a raw file manifest, allow scientists to select individual rows for their manifest download. This allows additional granularity beyond the filter panel.
Check the box at the beginning of the desired row(s) and then trigger the download.
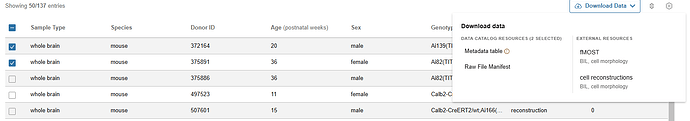
Remove row selections individually.
Note: They also get removed when you clear all filters via the Clear all button.
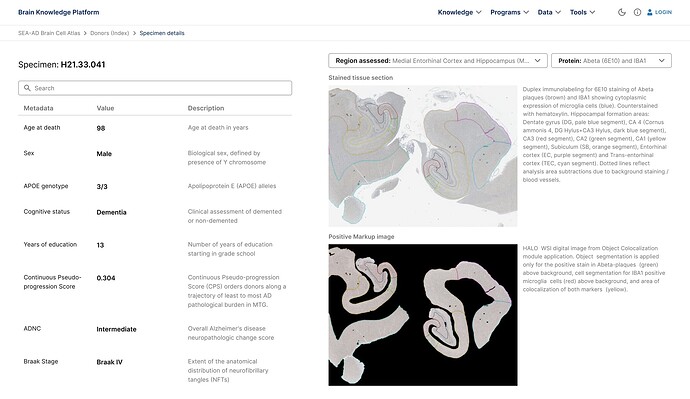
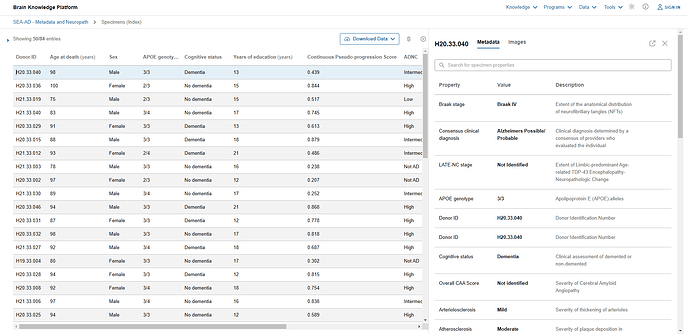
Side panel: specimen metadata
Click on a table row to open the specimen’s metadata details view in a side panel on the right. Note that the row remains highlighted in the table. The metadata details view features all metadata for a given specimen and goes beyond the chosen display defaults. It allows scientists to get the gist for any given specimen. Scientists can quickly find the relevant to them metadata field via test search across the metadata properties, values, and description.
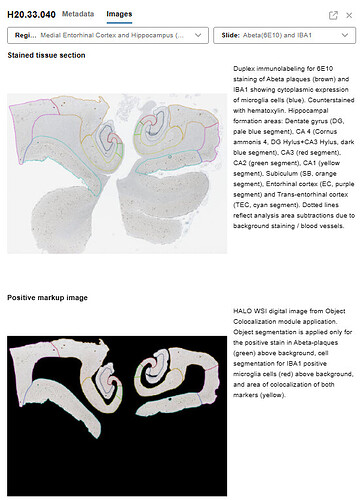
Side panel: image viewing
When available, this is the default loaded state of the side panel. The side info panel includes access to relevant imaging data, e.g. neuropathology or epifluorescence.
The image viewing will feature at least one of the following solutions:
- an integrated image view with dropdowns to select your image of choice
- a preview of the available images
- a link to open the image in a dedicated image viewer in a new tab
Note: Neuroglancer previews are interactive. Scroll with your mouse wheel to flip through the image slides. Use Ctrl + Scroll to zoom in on the image location your mouse curser is pointed.
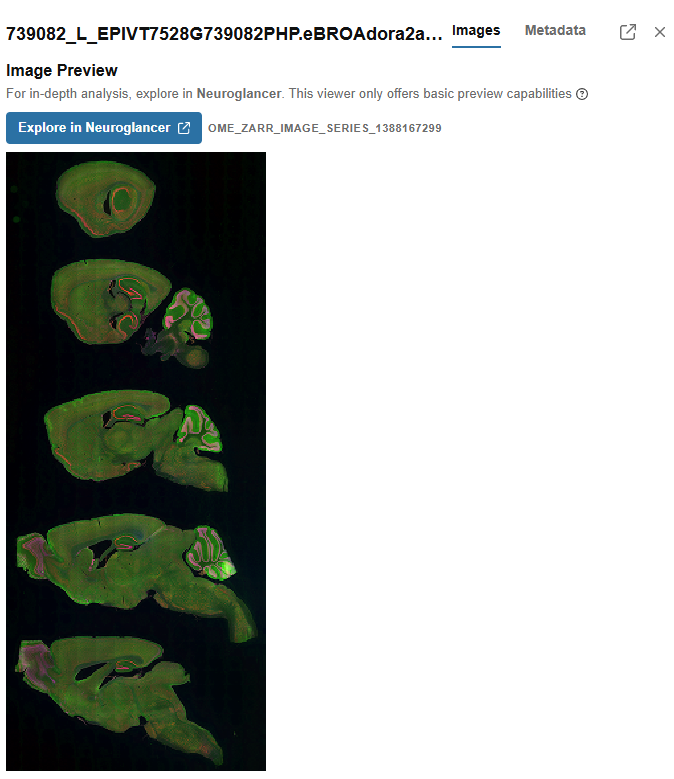
Specimen details view
In the side info panel, click on the following icon to open the specimen details view:

It opens a new tab that features the above specimen metadata and image viewing tabs side by side.
Breadcrumbs allow scientists to navigate within the current project.