Data Visual Coding
Neuronal Response: Two-Photon Calcium Imaging
The first data modality to be released from the Allen Brain Observatory is a standardized in vivo survey of physiological activity in the mouse visual cortex, featuring representations of visually evoked calcium responses from GCaMP6-expressing neurons at selected cortical depths and visual areas.
Experiment Design
In this study, an experiment is composed of three one-hour long two-photon calcium imaging sessions on an awake mouse presented with a series of visual stimuli. An experiment is the unique combination of one mouse, one imaging depth (e.g. 175 um from surface of cortex), and one visual area (e.g. “Anterolateral visual area” or “VISal”). Each experiment includes three imaging sessions as illustrated below. Data released in the June 2016 and October 2016 releases were collected using sessions A, B and C. Data released in the June 2017 release were collected using sessions A, B and C2.
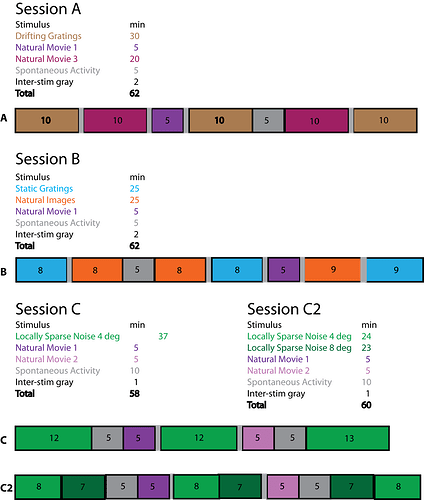
For more information on the experimental design and the visual stimulus set, see the Stimulus Set and Response Analysis whitepaper in Documentation.
Targeted Functional Visual Areas
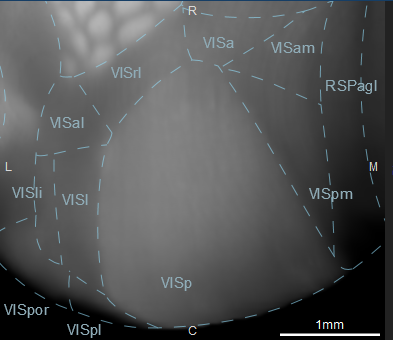
*Wang and Burkhalter (J.Comp.Neurol., 502: 339-357. doi: 10.1002/cne.21286)
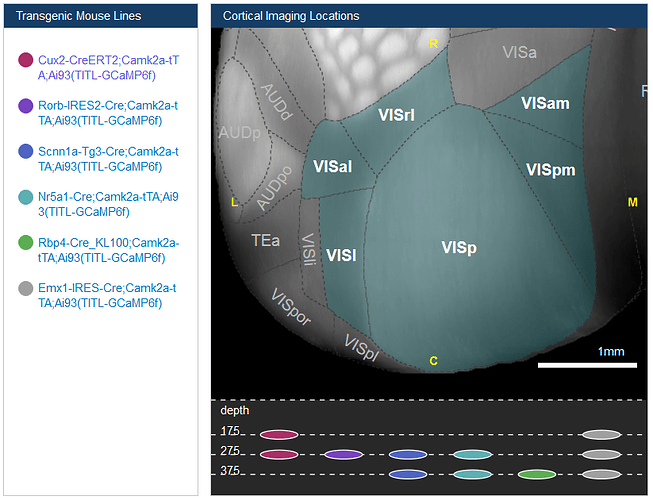
Transgenic Lines
Two-photon calcium imaging was recorded in neurons expressing a calcium-sensitive fluorescent molecule. This is made possible by the use of animals harboring a genetically encoded calcium sensor, GCaMP6, which is imparted by use of the Ai93 line and expressed in subsets of cell populations due to a combinatorial transgenic line breeding strategy. The transgenic lines are a cross of CaMK2a-tTA - a transgene directing tetracycline-controlled transactivator protein (tTA) expression in forebrain excitatory neurons - and one of the following:
- Cux2-CreERT2
- Rorb-IRES2-Cre
- Rbp4-Cre_KL100
- Nr5a1-Cre
- Scnn1a-Tg3-Cre
- Emx1-IRES-Cre
Histological characterization for each of these triple transgenic mouse lines is available by clicking on the Transgenic Characterization tab in the menu banner. Further characterization of each of these transgenic lines can be found in the Transgenic Mouse Catalog in Documentation.
Searching the Data
The data can be searched either by experiment or by cellular response. To search for experiments or cells that have specific response characteristics, click on the respective Experiments tab or Cells tab from the menu banner.
Exploring the Data from the Interactive Landing Page
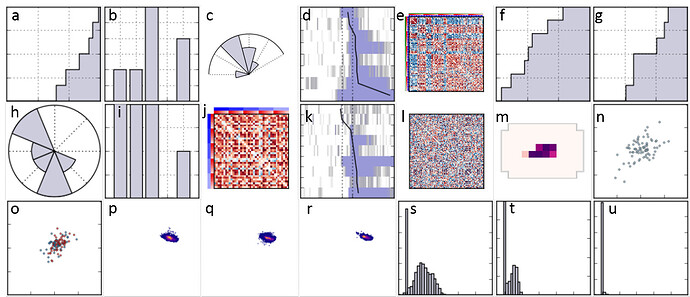
The Allen Brain Observatory includes a variety of data visualization summaries capturing visual coding properties of single cell and cell population responses to visual stimuli. This resource introduces new visualizations that summarize the cellular responses for each visual stimulus in a single figure:

The Visual Stimulus pages include details on how to interpret these visualizations and how they were created. Clicking the stimulus from the panel below the cortical imaging locations to reach these pages.

The landing page shows a visual summary of the dataset contents. Transgenic mouse lines (left panel) were selected based on the subpopulation of neurons expressing GCamp6. From the landing page, you can explore the transgenic mouse line, cortical area and cortical depth of the experiments conducted in this study. Hovering your mouse over the transgenic lines, cortical area or cortical depth will highlight the parameters captured in the experiments of this study. Clicking one of these interactive links will return a Cell Search with those specific criteria.
Below the visual stimulus links are another interactive search feature that will return a list of cells that responded to the visual stimulus. Click one of the links to perform this kind of search.

Experiment Search

Clicking “Experiments” in the menu banner will take you to a Experiment Search page. By default, all experiments conducted in this study are listed on this page. The list of experiments can be sorted/filtered by clicking the “Show Filters” button which opens options for selecting experiments by Brain Area (VISal, VISp, VISl, VISpm, VISam, VISrl), Imaging Depth in microns (175, 265, 275, 300, 320, 335, 350, 365, 375, 435) or by Cre Driver (Rbp4-Cre_KL100, Cux2-CreERT2, Emx1-IRES-Cre, Scnn1a-Tg3-Cre, Rorb-IRES2-Cre, Nr5a1-Cre).
Each experiment is displayed by a row in the results list below the Filters menu. All of the columns (minus the two common mouse lines) are displayed by default. Columns can be hidden by deselecting them from the drop-down menu. The population thumbnails are segregated by visual stimulus as indicated by the stimulus color key. Overall cell population responses of the neurons in the imaging field of view to a specific visual stimuli are displayed as population thumbnails and can be explored in more detail from the Experiment Detail Page. More information on how these features were computed can be found in the Stimulus Set and Response Analysis whitepaper located in Documentation.
Experiment Detail Page
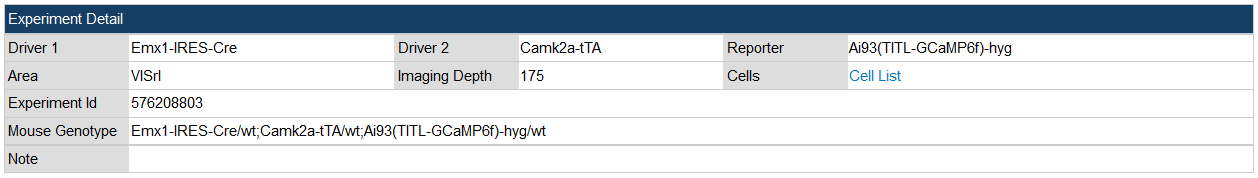
Each experiment is composed of three approximately one-hour two-photon calcium imaging sessions.The experiment detail page presents a more detailed view of each experiment including detailed experiment information, summary images of the cortical field of view in each experiment and the calculated cell population features and metrics as represented by the population thumbnails.
Detailed information about each experiment is listed at the top of the page, including mouse genotype information, cortical area imaging depth that the data was acquired from, a link to the Cell List - which summarizes the cell responses for each of the two-photon calcium imaging sessions, and experimental series identifier. Some experiments will have notes with information about special considerations, such as animal physiology. Summary images of the cortical field of view from each of the imaging sessions are also shown.
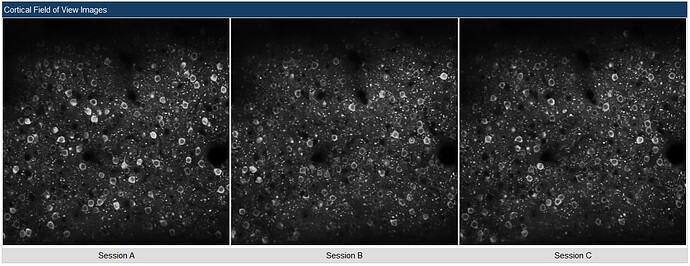
Population Thumbnails
The cortical field of view that is captured in a single imaging session is referred to as the “population” of cells that are recorded simultaneously. Population image thumbnails are shown on the Experiment Search page, with a description of the data that may be available from each of these sessions.
Cell Search
Clicking the “Cells” tab from the menu banner will open a search page from which all the cells from every experiment can be filtered and sorted. Filtering subselects cells that meeting the filtering criteria, while sorting orders the cells (filtered or not) by the selected metric. Clicking the interactive panelsfrom the Allen Brain Observatory landing page or the “View Cells” link from an Experiment Detail Page will open the Cell Search page with filtering already pre-set.
Cell List
This page displays the cellular response summaries of a cell search with one cell per row. Clicking anywhere on a row will take you to the Cell Detail Page. More information on the development of each of the thumbnails and it’s corresponding visual stimulus can be found from the “Visual Stimuli” buttons on the Overview page.

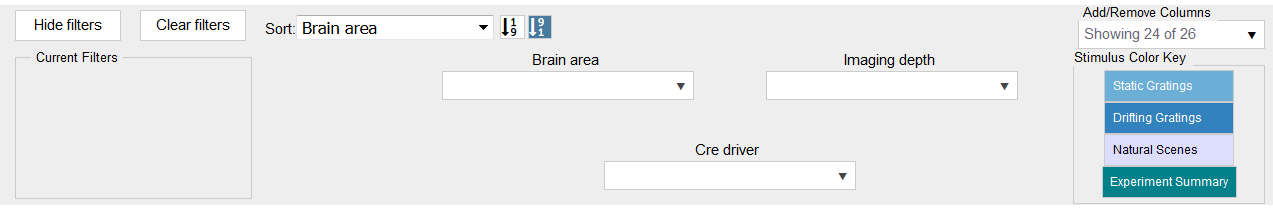
Filtering Cells
To filter the cells based on cellular responses across all the experiments, first click on the “Show filters” button at the top left-hand corner of the webpage.
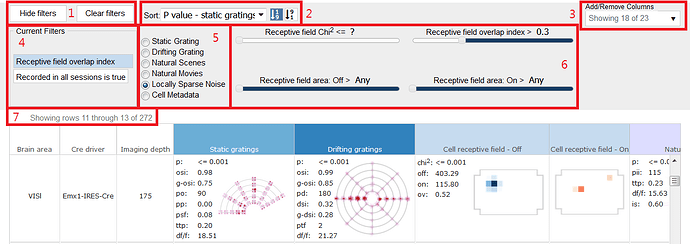
- Filters: Show, hide or clear filters by clicking these buttons
- Sort: Sort by parameter and choose either ascending or descending sort
- Add/Remove Columns: Increase or decrease the number of columns shown in your cell search results
- Current Filters: Filters will show in the box once applied
- Filter Parameters: Clicking a radio box will determine which visual stimulus or metadata parameters you can filter on
- Filter Criteria: Parameters are visual stimulus and metadata dependent.
- Row Number: The number of cells included in the filter criteria
More information can be found on these thumbnails and metrics from the Cell Detail Page
Sorting Cells
By default the cells are sorted based on the significance of their measured responses to presentation of the static grating, listed here as their p-value, but can also be sorted by several other parameters from the “Sort” drop-down menu. The list of cells includes metadata on the experiment (Brain area, Cre driver, Imaging depth) and 23 response summaries (including visualizations and computed metrics) to the various visual stimuli. Of the 23 columns available, only 18 are displayed by default, but can be displayed from the “Add/Remove Columns” drop down menu in the filters box. Sorting is based on the calculated features derived from the cellular responses to the visual stimuli.

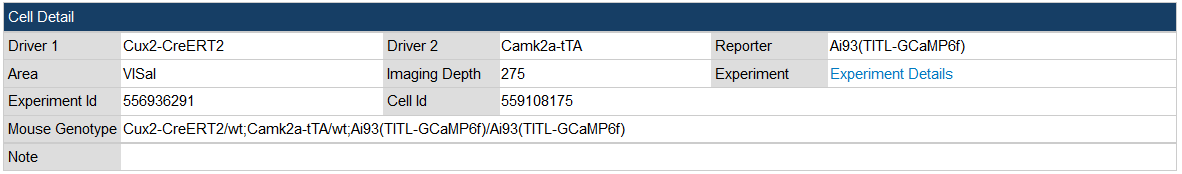
Cell Detail Page
Information at the level of the individual cell is available from this page. Similar to the Experiment Detail Page the top of the page provides detailed information from the experiment from which this cell was imaged.
For every stimulus that the selected cell was responsive to, a large thumbnail will be available to interact with. Hovering your mouse over the thumbnail will reveal the the selected visual stimulus. Each thumbnail also includes metrics calculated from the cell responses. clicking the “i” next to a visual stimulus will link to the webpage explaining both the stimulus as well as the thumbnail plot developed to describe the cellular response. Clicking on the stimulus in the table below will link to those same pages.