Image Series Details Mouse Spinal Cord
Image Series Detail
Gene Symbol
This section shows some gene metadata, including any alternate names for the given gene. If we have data on the same gene in the Allen Brain Atlas project, a link will be included here.If there is a homologue for the current gene in humans and we have data on it in the Human Cortex project of the Allen Institute, a link will be included in this section.
Expression Info

The colored bars in the Expression Info area are a more detailed version of the expression chart from the search result page, as described above. As in the smaller version of the chart, bars are colored green where expression was detected in the corresponding image and white where expression was not detected. There will always be 16 bars in the chart; in cases where an image is not available, the bar will be colored black.
In this detailed view, each bar in the chart is labeled with the image index, tissue index, & annotated segment abbreviation (if available.) The image index refers to the position of the image relative to the image series; these will range from 1 to 16. The tissue index refers to the position of the section relative to the specimen as a whole.
External Resources
The External Resources section contains links to other organizations that provide gene expression data. These links open in a new browser window, and should show information related to the current gene.
Image Detail Page
The image detail page displays the ISH images from one or more image series. A number of different display and formatting options are described below. Use the layout buttons (see below) located on the page toolbar to switch between the various layout options.

Using the Zoom and Pan (Zap) Image Viewer
The default layout shows one or more zoom-and-pan (zap) viewers. The zap viewer allows you to navigate through an image series’ thumbnails to select an image to view at higher resolution. Once selected, you can use your mouse or keyboard to zoom and pan the larger image. Additional image manipulation tools are described below.
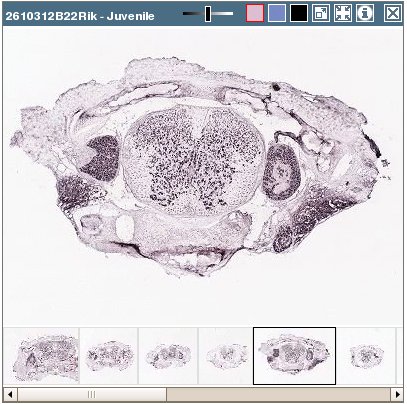
Image Manipulation
Select a thumbnail from the bottom of the image series’ window to open its image in the viewer window. Drag the image with your mouse pointer to an area of interest, then use the plus (+) and minus (-) keys or the wheel on your mouse to zoom in and out.
| Move the slider bar to the left to intensify the contrast or color. | |
|---|---|
| Select ISH, Nissl or expression mask image type. | |
| Open the selected image in a high-resolution viewer in a new browser window. | |
| Synchronize the images in other viewers on the page to the currently selected image. Only images from specimens of the same age will be synchronized. | |
| Open a new browser window to review metadata for the image series. | |
| Close the viewer. |
Multiple image series can be opened on the same Web page to enable side-by-side comparisons. You can swap viewers’ positions on the page by clicking on the first viewer’s title bar and dragging it to the second viewer’s position.
Alternative Layouts
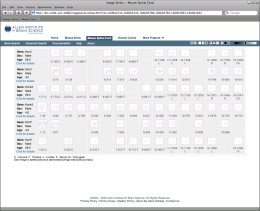
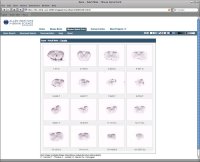
The layout buttons on the image control toolbar can be used to switch between the contact sheet & row-based views.
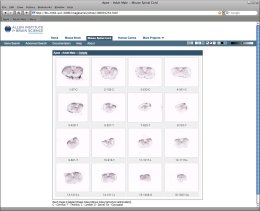
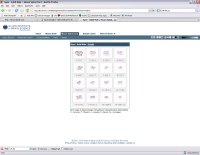
The contact sheet layout for a single image series looks like the image to the left. Images are arranged in four rows of four. This view is probably most useful for a single image series.
Multiple image series will be shown in a row-based layout, as shown at right. This view allows all the images from a large number of image series to be visible at one time.
Size

The sizing buttons on the toolbar can be used to change the size of the thumbnails.
By default, the largest thumbnail size is used when viewing a single image series. When multiple series are compared, a smaller thumbnail size will be used. You can override these default values by using the image sizing buttons on the toolbar.

Magnifier
As you move your mouse over each thumbnail, a magnified version of the image will pop up. Use the magnifier buttons to set the size of the magnified image, or disable the magnifier. The currently selected magnifier button will be highlighted with a red border.


To the right are examples of the small & large magnifiers in use.
Clicking on any of the thumbnails will launch a high resolution viewer for that image in a new browser window. See the Single Image Viewer section below for details on working in that view.
Image Type
There are two related images available for each ISH thumbnail:
- The enhanced expression mask. This image is constructed from the signal detected by our image analysis algorithms. This is a grayscale image where the lighter areas indicate stronger signal. Due to the generally low signal, we are showing by default an enhanced version of the expression mask. The bright points in the image have been enlarged and brightened further to make expression more easily discernable in the small thumbnail images presented here. NOTE that clicking on the expression mask thumbnails will open the image in a high resolution image viewer. The expression mask image is not enhanced in the high resolution viewer.
- The closest Nissl stained section. Every tenth section is Nissl stained.
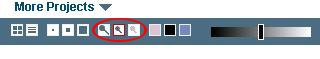
Clicking on the black button in the “associated image” toolbar group (see below)
) will swap out the ISH image and swap in the expression mask image. To return to the ISH image, click on the ISH button (see below).


Button

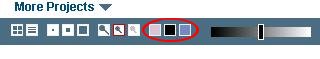
Clicking on the “nearest Nissl” button (see below) will toggle the display of the nearest Nissl image for each thumbnail. The Nissl image will be displayed beneath its corresponding thumbnail, as shown at left. The nearest Nissl image is available whether the ISH or expression mask thumbnail is currently being shown.

Button
Contrast/Brightness

Use the slider control on the toolbar to increase or decrease the contrast and brightness of the thumbnails. Changing this setting will affect both ISH & expression mask thumbnails, but not Nissl images.
The center position is “neutral,” that is, no enhancement is applied to the images. Moving the slider to the left will darken the images, moving to the right of center will brighten them. To reset the slider to its default position for the type of image currently being displayed, click on the corresponding Image Type button.
The default position for ISH images is “neutral”, while the default position for expression mask images is about +80% brightness.