This study collected high-resolution in situ hybridization image data covering selected genes during development. For a list of genes, please see the gene list under the Documentation tab in the main banner of the web application. The data includes a survey of five major brain regions during four postnatal developmental periods for genes clinically important in a variety of human neurodevelopmental disorders, serial analysis of selected genes across the entire adult brain, focusing on cellular marker genes, genes with cortical area specificity and gene families important to neural function and whole brain serial analysis of genes ENC1 and GAP43 to aid neuroanatomical delineations for prenatal microdissection microarray.
You can search this data using Gene Search by typing a gene-related term into a search field, searching by Gene Classification, using the Advanced Gene Search feature or with the Annotation Search which utilizes manual annotation of the image data.
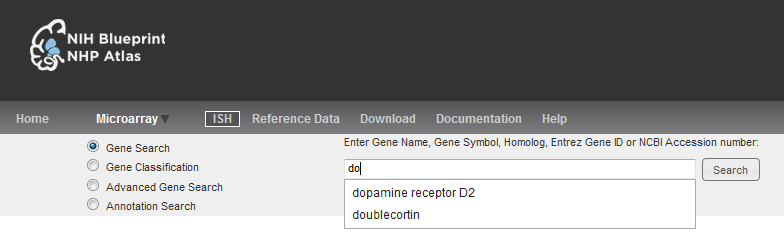
To search for a gene, select the Gene Search radio button and then type the gene symbol, gene name, gene aliases/alternate symbols, predicted human homolog gene symbol, NCBI Accession Number, or Entrez Gene Id into the search box. A list of suggested options will open, and you can select from one of those suggestions.
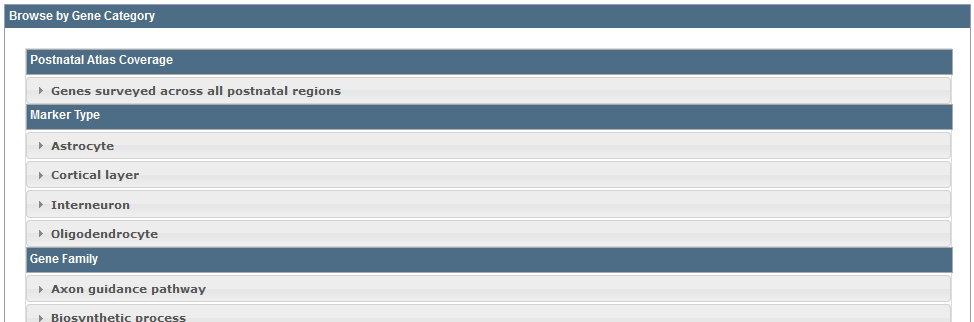
The ISH data only includes a select number of genes so you can browse the data using the Gene Classification menus. When you land on the ISH Data page, the categories are displayed allowing you to search the genes included for each category.
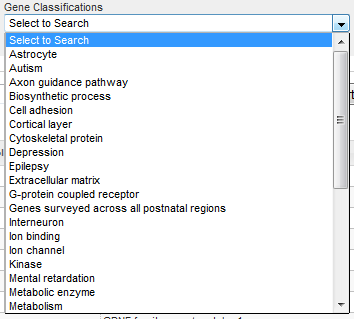
If you are on any other page in the ISH project, click on the “Gene Classification” radio button and select a category from the drop-down menu.

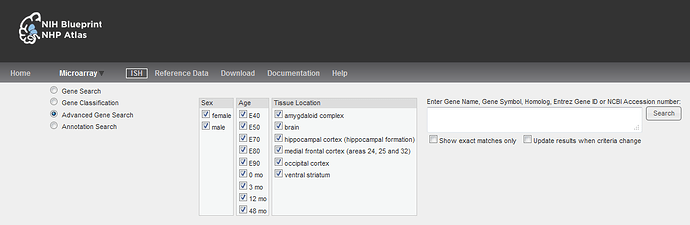
The Advanced Search allows you to narrow your gene search by gender, developmental stage and by tissue location. When you select the “Advanced Gene Search” radio button, you will be able to deselect the categories that don’t pertain to your search. If you do not enter a gene in the search box, all genes that fulfill your search criteria will be returned.
Experiments conducted on the post-natal stages were manually annotated for their Expression Intensity and their Expression Density.
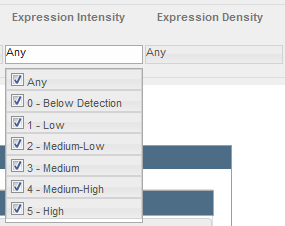
For a detailed description of the manual annotation process, please see the ISH whitepaper in the NHP Documentation. Briefly, both the expression intensity and the expression density were scored on a scale from 1-5.
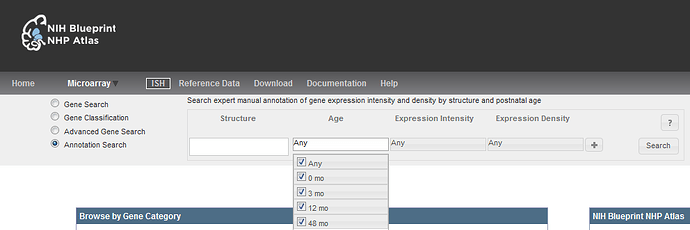
To perform an annotation search, first choose the brain region or structure of interest from the ontology. Clicking in the Structure search box will open the drop-down menu with all the available structures or regions. Either begin typing your structure into the search box or browse the list in the drop-down. Once you have chosen a structure, choose the developmental stage, the expression intensity and density you are interested in seeing and then click “Search”.
If you would like to include more than one structure in your search, click the “+” button, and repeat the above instructions. If two or more structures (or ages or intensities or densities) are selected in a single row, the search will find all results that match any one of the criteria (i.e. an “OR” search within a row). If more than one row is used, only genes that meet the criteria in ALL rows of the search will be returned (i.e. an “AND” search between rows).
Searches will return a list of experiments based on the input search criteria. Each row includes the following information.
You can sort your results by any any of the columns in either ascending or descending order (by checking the box next to your sort parameter).
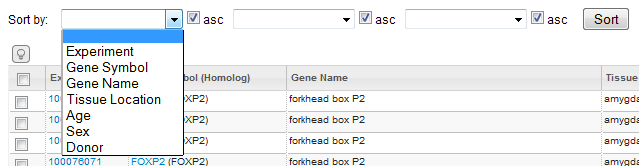
Select the experiments to view in greater detail by clicking on the checkboxes next to your experiments of interest. Experiments will be saved in your cache until you select the “Clear Selections” button at the bottom of the page. After selecting one or more experiments, click the “View Selections” button.
At the bottom of the search results table, there is a link to an XML document containing all of the data in the result set.
Clicking on the “View Selections” button will open all selected experiments in a new window within individual viewers. The individual experiments can be moved around by clicking and dragging on the title bar and number of columns in this window can be changed by clicking on the gear in the top right-hand corner of the screen.

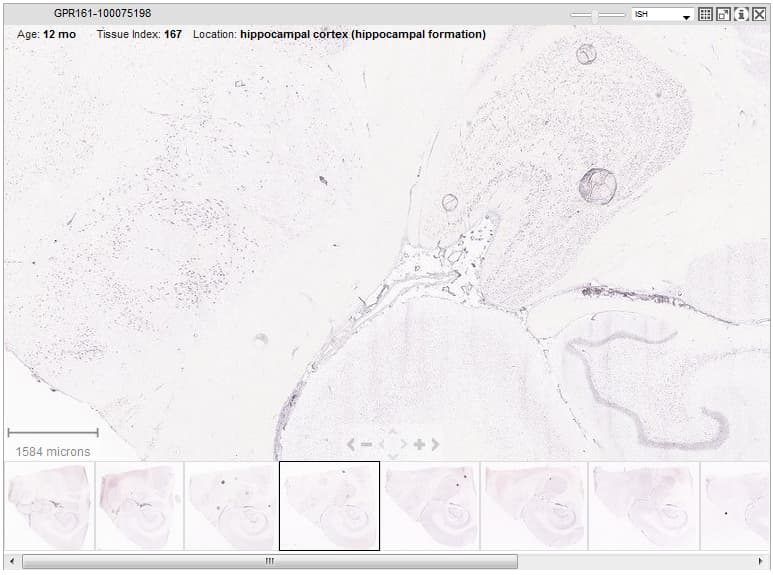
The ZAP image viewer allows you to navigate through an experiment’s images by selecting from one of the thumbnail images along the bottom to select an image to view at higher resolution. The current selection is outlined in black. Once selected, you can Zoom and Pan using the onscreen navigation buttons or use the keyboard commands or the toolbar icons to take additional actions.
The gene symbol or treatment type is displayed in the title bar along with the image series ID. Additional details are displayed across the top of the viewing area, including the age, tissue index and tissue location.
Shows the current viewing resolution of the image, in microns. This value dynamically changes as you zoom in/out of the image. You can position the scale bar anywhere on the main image by dragging the scale bar by its ruler.
You can toggle the orientation of the scale bar from horizontal to vertical by clicking on the scale bar text.
The high resolution image viewer is a viewer that opens in a new window and allows you to get a more detailed view of the experimental images in a structural and cytoarchitectural context.
Opening the High Resolution Image Viewer will open a new window with your ISH experiment and a side-by-side view of the nearest Nissl image. The left hand viewer shows the ISH image series and the right hand viewer displays the Nissl image series from the same specimen block. By default, the nearest Nissl section to the ISH image you are interested in will be shown and synched with the section you are viewing. Click the “Sync” checkbox to manually correct any synching between the images. Clicking on another ISH image will automatically display its nearest Nissl section. Clicking on an image thumbnail in the Nissl image series will automatically take you to the nearest ISH image. While the “Sync” box is checked the Pan and Zoom functions will affect both ISH and Nissl images.
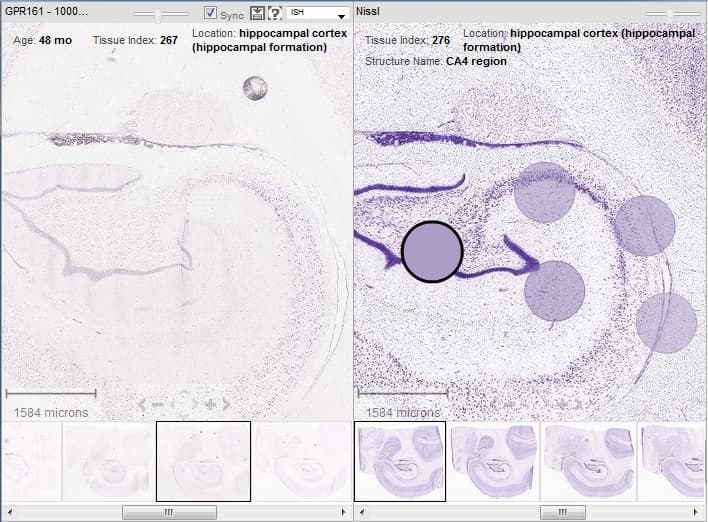
Colored circles in the Nissl slides are hotspots - regions that when moused over list the brain regions manually labeled by our Annotation team.
To download an image, click on the Icon (see below).

The Expression mask image display highlights those cells that have the highest probability of gene expression using a heat map color scale (from low/blue to high/red).


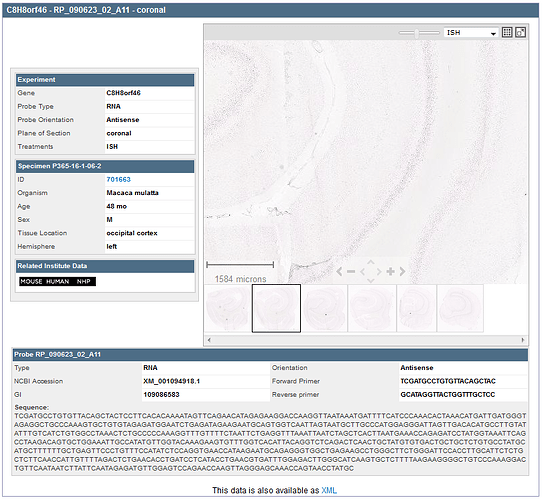
Clicking on the Experiment ID from the search results page or the “i” icon from the image viewers will take you to a page which includes metadata on the experiment, the specimen and the probe as well as related institute data links and a ZAP viewer for all images in the series.
This box gives you information on the gene assayed, the probe type and orientation, the plane of section and the kind of treatment (i.e. ISH, Nissl)
This box lists the Donor ID in the title bar and lists the Specimen (Clicking this link will open the Specimen Detail information), organism, age, sex, tissue location and hemisphere.
This box lists the Probe ID in the title bar and includes the type of probe, orientation, NCBI Accession #, GI # and the sequences of the forward and reverse primers so you can recreate this probe for your experiments. It also includes the probe sequence for your reference.
Clicking on the specimen link from the search results page or on the specimen link in the experiment details page will take you to detailed specimen information. Specimen detail information includes Specimen Information, Section Information, Gene Information and an Image Viewer.
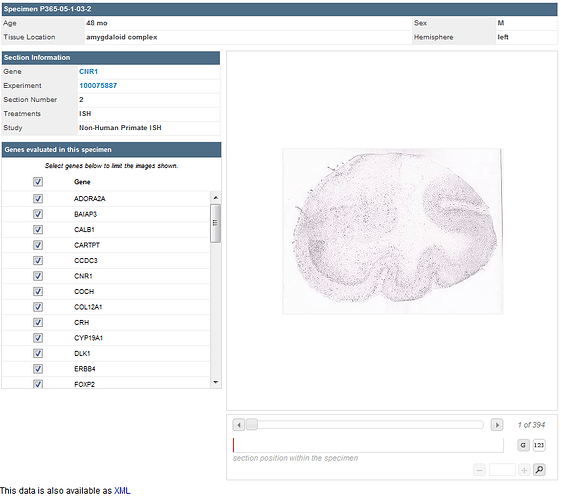

Specimen ID - internal ID
Age - years
Sex - male or female
Tissue Location - tissue origination in brain
Hemisphere - right or left hemisphere tissue origination

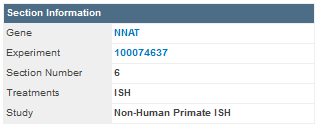
The section information box lists information from the current gene pictured in the image viewer including the gene name, the Experiment ID, the section number, the treatment and which study the data came from.
The Gene information section lists the genes that were assayed in this specimen block.
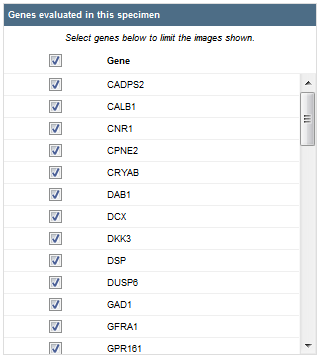
By default, all genes from this specimen are selected for viewing. You can select fewer genes/histological stains to view in the image viewer by first clicking the “Gene” checkbox, then selecting the checkboxes next to the gene/stain(s) you would like to view.
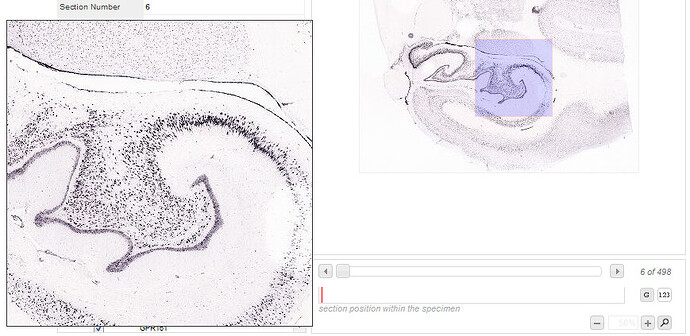
The viewer displays the image from the current gene listed in the section information box. Below the image, there is an indicator of the position in the specimen block of that particular section, as well as a visualization of the depth of the section into the block. You can view the sections in order (default or by clicking the 123 icon (see below) or grouped by Gene Icon (see below).


When you click on the magnifying glass in the bottom of the image viewer, a new window will open with a magnified view the area in the image viewer outlined by the red box. you can increase or decrease the magnification by clicking the “+” or the “-” buttons.
This data can be downloaded as an XML file.
Learn about Microarray Data For NHP Atlas with comprehensive guides and examples from Allen Institute for Brain Science.
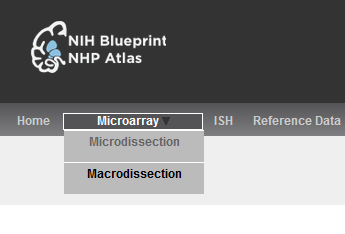
There are two sets of microarray data in this resource; Micro- and macrodissection studies, both assayed on the Affymetrix GeneChip Rhesus Macaque Genome Arrays. The Macrodissection study includes microarray data assayed from samples that were dissected manually from four postnatal stages in five specific sample tissue locations; medial frontal cortex (areas 24, 25 and 32), occipital cortex, hippocampal cortex (hippocampal formation), amygdaloid complex and basal nuclei (basal ganglia). The Microdissection study looks at smaller more targeted subdivisions of the structures considered in the macro study in four postnatal stages and six prenatal stages. These smaller regions, such as a single cortical layer of cells, were microdissected using a laser dissection microscope. To choose between these data sets, select “Microdissection” or “Macrodissection” from the Microarray drop down menu.

You can browse the data using the three search tools: (1) Gene Search, to obtain gene expression data for specific genes of interest, (2) Differential Search, to compare expression between two sets of brain structures at desired developmental stages, and (3) Correlative Search, to find genes that have an expression pattern similar to a “seed gene” selected from the results of a Gene or a Differential search.
Some search modes offer additional information, accessible by clicking on the “?” next to the Search button.

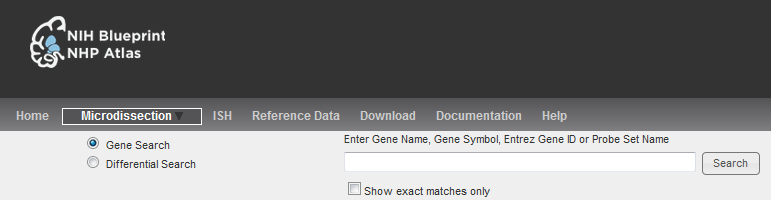
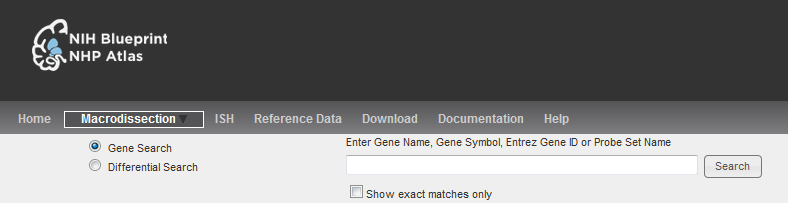
To search for probes associated with a specific gene, select the Gene Search radio button, type the gene name, gene symbol or Entrez Gene ID in the search box and click the “Search” button. You can also select an entry from the list displayed as soon as you start typing. To be able to search the Macaque database for human gene homologues, search using:
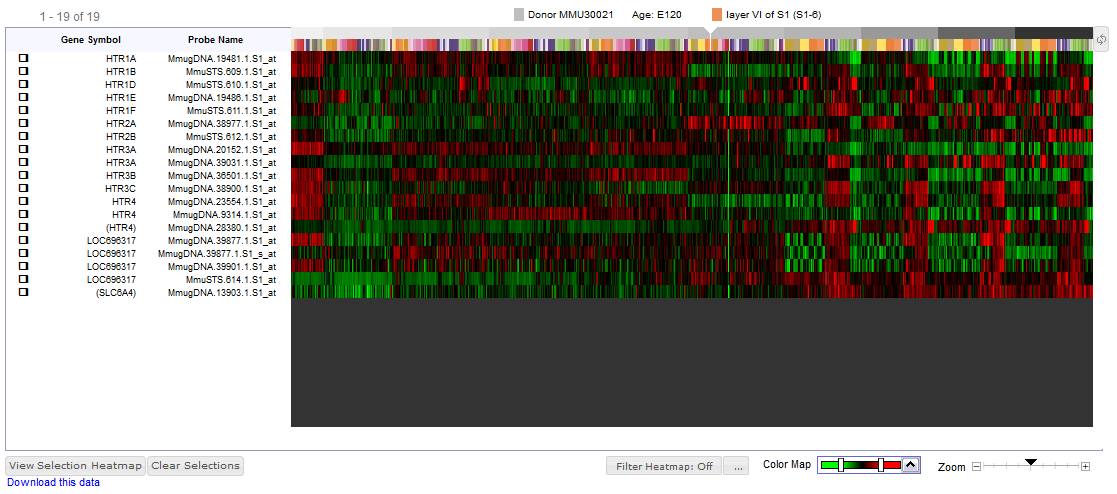
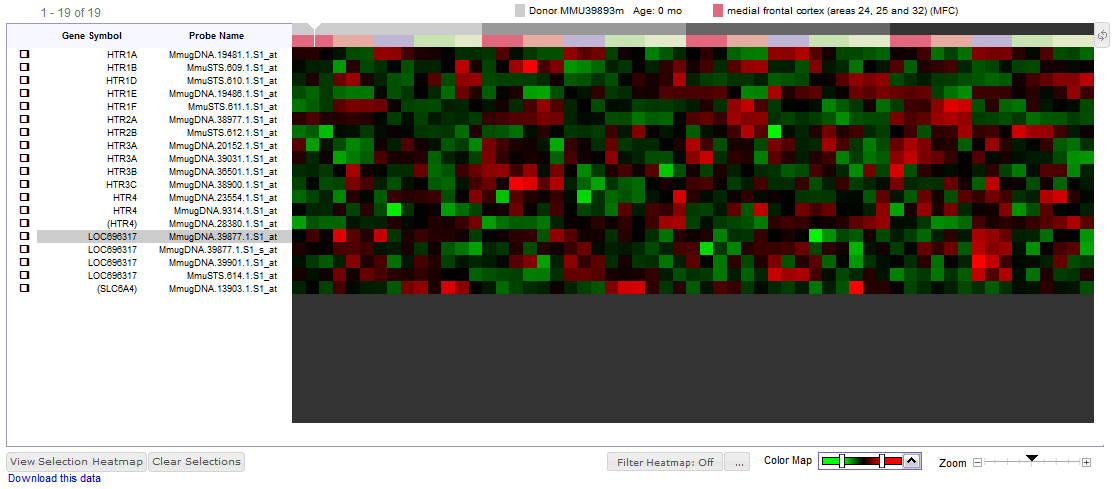
The search results are displayed in the form of a heat map showing the expression values for the probes that match the search criteria. Since the microarray may have more than one probe per gene, the heat map’s left panel shows Gene Symbol and Probe Name for each row.
Gene symbols and gene names are displayed as follows:
See Microarray Data Visualization for information on reading heat maps.

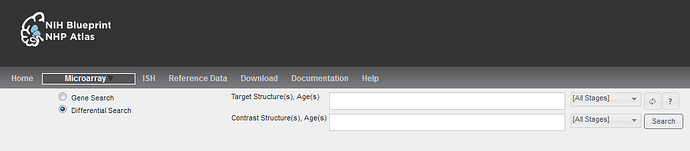
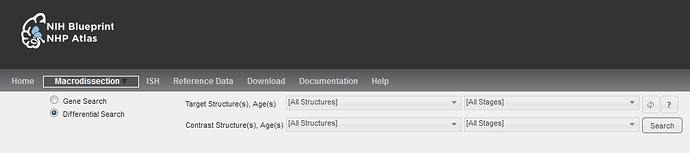
This dataset can be searched to find genes that show enrichment of expression in one set of samples compared to another set of samples. Those samples can correspond to different brain structures and/or different developmental stages. To perform this type of query, select the “Differential Search” radio button. To find genes or probes with enhanced expression profiles in a target set of samples when compared to a contrast set of samples, first select the Target and Contrast Structures by starting to type the structure name in the text box - a structure ontology of the applicable structures will appear and you can select from this menu. Then, select the desired developmental stages using the Ages drop down boxes for both the Target and Contrast Domains.
You can reverse Target and Contrast Domains by pressing the toggle button above the Search button.

The search results will shown in the form of a Heatmap with genes that exhibit higher expression in the target domain ranked higher than those in the contrast domain by either p-value or by fold change. To alter the sort parameter, click on either the “p-value” or the “Fold Change” buttons. Since the macaque genome is not fully annotated, many probes do not have a corresponding associated gene. In those cases, the probe name is displayed under the Gene Symbol label.
Since genes with similar expression patterns may be related in function, the NHP Atlas includes functionality to search the dataset for genes whose expression over a given set of structures or developmental stages resemble the expression pattern of a gene of interest.

First, the gene of interest must be selected from the heatmap returned by a Gene or Differential search by clicking on a data-point in the heatmap. The corresponding probe will be displayed under the “Find Correlates” button close to the top right corner of the heatmap. Next, select the desired structures and developmental stages from the drop down menus and then click “Find Correlates”.
The resulting heatmap displays the list of probes based on the search criteria ranked by Pearson’s correlation “r” with the gene of interest. To find the anti-correlate, click the “r” button.
To filter the heatmap display to show specific structures or developmental stages, use the “Filter Heatmap” function at the bottom of the heat map.
The results for all three types of searches against microarray data are displayed in two horizontal page sections:

Based on your search, the resulting microarray data are presented as a matrix with brain structure and developmental stage on the horizontal x-axis and gene probes on the vertical y-axis. On the horizontal axis, developmental stages are represented on top, color coded in shades of gray such that moving from left to right corresponds to increasing age. Brain structures are represented in bright colors immediately below, such that moving left to right corresponds to moving in the anterior to posterior direction, first in the cortical areas, followed by subcortical areas, cerebellum and brainstem.
Each column therefore represents a structure for a specific developmental stage. On the vertical axis, each row represents a probe rather than a gene, because multiple probes were used to measure gene expression for a gene. Additionally, since the macaque genome is not fully annotated, many probes do not have a corresponding associated gene. In those cases, the probe name is displayed under the Gene Symbol label.

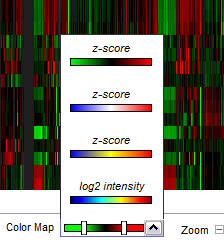
The microarray data is presented in a heat map format where the colors of the heat map correspond either to normalized data (log2 Intensity) or to a normalized (z-score) expression level of a probe. Default heat map colors the z-score in the green – red scale, where green represents underexpression and red overexpression of that gene compared to expression throughout the brain. The window and level for the colors may be adjusted, and other color schemes may be selected, by using the Color Map control under the heat map. The slider on the bottom right can be used to adjust the zoom level. In the top right hand corner of the heat map, there is a toggle button, which when clicked will sort the heat map data either by donor or by structure.
To view expression patterns of the returned probes in specific regions of the brain or in specific developmental stages, filter the heatmap display from the function below the heat map.
You can select a set of probes for later use by checking the checkboxes besides the list of gene symbols. Your choices are stored in a browser ‘cookie’ in your computer and will remain in effect until you click the “Clear Selections” button or clear your web browser’s cookie cache. Click the “View Selection Heatmap” button to see your selections.

Clicking on a heat map cell populates the top section of the page with detailed information about that cell. This information includes gene symbol, gene name, NCBI Entrez ID, probe name, chromosome, as well as the sample’s structure and specimen’s age. It also shows the exact expression values by their log2 intensity and z-score.
The section also contains buttons to navigate to related data in other Allen Brain Atlas resources.
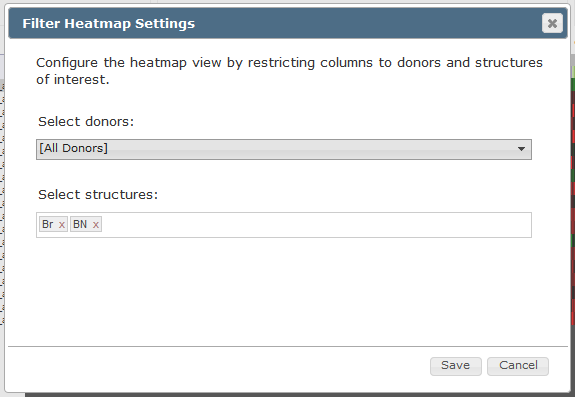
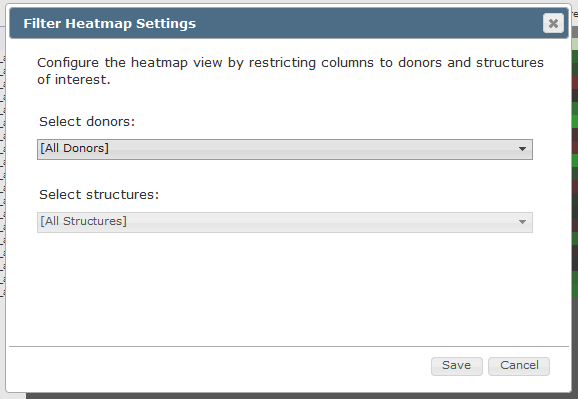
If you are interested in narrowing the number of donors or structures, use the “Filter Heatmap” function below the heatmap. Clicking on the “…” button will bring up a menu where you can choose the donors and structures you’d like to visualize. Once you have saved your options, turn on the Filter Heatmap function by clicking the button.

This dataset includes microarray data manually dissected from five brain regions; medial frontal cortex (areas 24, 25 and 32), occipital cortex, hippocampal cortex (hippocampal formation), amygdaloid complex and the basal nuclei (basal ganglia), from four post-natal stages.
You can browse the data using the three search tools: (1) Gene Search, to obtain gene expression data for specific genes of interest, (2) Differential Search, to compare expression between two sets of brain structures at desired developmental stages, and (3) Correlative Search, to find genes that have an expression pattern similar to a “seed gene” selected from the results of a Gene or a Differential search.
Some search modes offer additional information, accessible by clicking on the “?” next to the Search button.

To search for probes associated with a specific gene, select the Gene Search radio button, type the gene name, gene symbol or Entrez Gene ID in the search box and click the “Search” button. You can also select an entry from the list displayed as soon as you start typing. To be able to search the Macaque database for human gene homologues, search using:
The search results are displayed in the form of a heat map showing the expression values for the probes that match the search criteria. Since the microarray may have more than one probe per gene, the heat map’s left panel shows Gene Symbol and Probe Name for each row.
Gene symbols and gene names are displayed as follows:
See Microarray Data Visualization for information on reading heat maps.

This dataset can be searched to find genes that show enrichment of expression in one set of samples compared to another set of samples. Those samples can correspond to different brain structures and/or different developmental stages. To perform this type of query, select the “Differential Search” radio button. To find genes or probes with enhanced expression profiles in a target set of samples when compared to a contrast set of samples, first select the Target and Contrast Structures from the drop-down menu. Then, select the desired developmental stages using the Ages drop-down boxes for both the Target and Contrast Domains.
You can reverse Target and Contrast Domains by pressing the toggle button above the Search button.

The search results will shown in the form of a Heatmap with genes that exhibit higher expression in the target domain ranked higher than those in the contrast domain by either p-value or by fold change. To alter the sort parameter, click on either the “p-value” or the “Fold Change” buttons. Since the macaque genome is not fully annotated, many probes do not have a corresponding associated gene. In those cases, the probe name is displayed under the Gene Symbol label.
Since genes with similar expression patterns may be related in function, the NHP Atlas includes functionality to search the dataset for genes whose expression over a given set of structures or developmental stages resemble the expression pattern of a gene of interest.

First, the gene of interest must be selected from the heatmap returned by a Gene or Differential search by clicking on a data-point in the heatmap. The corresponding probe will be displayed under the “Find Correlates” button close to the top right corner of the heatmap. Next, select the desired structures and developmental stages from the drop down menus and then click “Find Correlates”.
The resulting heatmap displays the list of probes based on the search criteria ranked by Pearson’s correlation “r” with the gene of interest. To find the anti-correlate, click the “r” button.
To filter the heatmap display to show specific structures or developmental stages, use the “Filter Heatmap” function at the bottom of the heat map.
The results for all three types of searches against microarray data are displayed in two horizontal page sections:

Based on your search, the resulting microarray data are presented as a matrix with brain structure and developmental stage on the horizontal x-axis and gene probes on the vertical y-axis. On the horizontal axis, developmental stages are represented on top, color coded in shades of gray such that moving from left to right corresponds to increasing age. Brain structures are represented in bright colors immediately below, such that moving left to right corresponds to moving in the anterior to posterior direction, first in the cortical areas, followed by subcortical areas, cerebellum and brainstem.
Each column therefore represents a structure for a specific developmental stage. On the vertical axis, each row represents a probe rather than a gene, because multiple probes were used to measure gene expression for a gene. Additionally, since the macaque genome is not fully annotated, many probes do not have a corresponding associated gene. In those cases, the probe name is displayed under the Gene Symbol label.

The microarray data is presented in a heat map format where the colors of the heat map correspond either to normalized data (log2 Intensity) or to a normalized (z-score) expression level of a probe. Default heat map colors the z-score in the green – red scale, where green represents underexpression and red overexpression of that gene compared to expression throughout the brain. The window and level for the colors may be adjusted, and other color schemes may be selected, by using the Color Map control under the heat map. The slider on the bottom right can be used to adjust the zoom level. In the top right hand corner of the heat map, there is a toggle button, which when clicked will sort the heat map data either by donor or by structure.
To view expression patterns of the returned probes in specific regions of the brain or in specific developmental stages, filter the heatmap display from the function below the heat map.
You can select a set of probes for later use by checking the checkboxes besides the list of gene symbols. Your choices are stored in a browser ‘cookie’ in your computer and will remain in effect until you click the “Clear Selections” button or clear your web browser’s cookie cache. Click the “View Selection Heatmap” button to see your selections.

Clicking on a heat map cell populates the top section of the page with detailed information about that cell. This information includes gene symbol, gene name, NCBI Entrez ID, probe name, chromosome, as well as the sample’s structure and specimen’s age. It also shows the exact expression values by their log2 intensity and z-score.
The section also contains buttons to navigate to related data in other Allen Brain Atlas resources.
If you are interested in narrowing the number of donors or structures, use the “Filter Heatmap” function below the heatmap. Clicking on the “…” button will bring up a menu where you can choose the donors and structures you’d like to visualize. Once you have saved your options, turn on the Filter Heatmap function by clicking the button.

Learn about Reference Data For NHP Atlas with comprehensive guides and examples from Allen Institute for Brain Science.
A set of developmental stage-specific reference series consisting of Nissl histology and magnetic resonance imaging (MRI) to provide neuroanatomical context for the developing macaque brain.
For more information, see the Reference Series technical white paper.
A set of supporting data consisting of ENC1 and GAP43 ISH staining, Nissl staining and AchE staining of select developmental stages to assist in neuroanatomical delineations.
For more information, see the Microarray Analysis technical white paper.
Learn about Documentation For NHP Atlas with comprehensive guides and examples from Allen Institute for Brain Science.