Transgenic Characterization
From this tab you can browse and select from reporter lines and driver lines used in the creation of the Allen Mouse Brain Connectivity Atlas.
Searching
Search the Transgenic Mouse dataset by entering a gene symbol or mouse line name into the search box. Retinal Projectome data includes four experiments with vertical mount sections of the retina. You will be prompted with suggestions once you have started typing. Click “Search” or hit the Enter key.
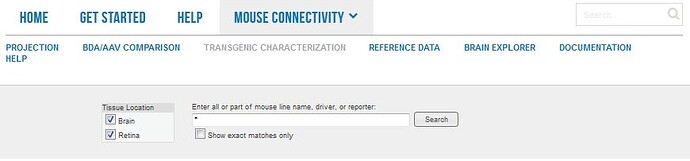
You can also browse through the data using tabs on the search page that illustrate all of the Driver Lines and Reporter Lines used in this resource.
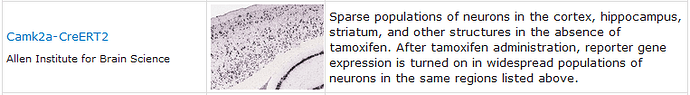
Driver Lines
Each driver line is represented by its name, a representative image (which is magnified when clicked) and a description of expression. Clicking on the line name will return results from all characterization experiments for that particular line.
Reporter Lines
This tab lists all the characterized reporter lines with a description of their expression patterns.
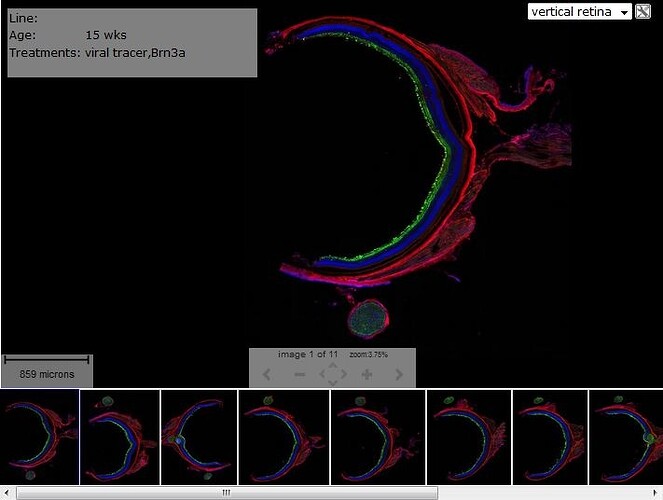
Retinal Projectome
Representative retinas were sectioned in the vertical plane for characterization of morphology and co-localization with markers for well defined retinal ganglion cell (RGC) types. Four markers were used:
- VAChT (vesicular acetylcholine transporter) - a marker of inner plexiform layers,
- CART (cocaine-amphetamine related transcript) - a marker of ON/OFF direction selective retinal ganglion cells,
- OPN osteopontin - a marker of large/ dephosphorylated neurofilament-positive RGCs,
- Brn3a which labels ~80% of all RGCs and is a Pit/Oct/Unc (POU) domain transcription factor.
Each experiment shows the GFP viral tracer infection in green, the marker in red and a DAPI stain in blue.
Search Results
Clicking on Search will return a list of experiments based on your search criteria with information on the Experiment ID, Line Name, Driver, Reporter, Probes, Age, Sex, Treatments and Image Count. Click on the Experiment ID to be taken to the Experiment Detail Page
To compare multiple experiments, mark the checkboxes to the left of each row, then click the “Compare Selected Experiments” button. Note: the selection list may contain previously selected experiments from the “Projection” or “BDA/AAV” studies. Your choices are stored in a browser ‘cookie’ on your computer and will remain in effect until you click the “Clear Selections” button, or clear your Web browser cookie cache.
Experiment Detail Page
Clicking on the experiment summary link returns a summary of the experimental details (see screenshot).
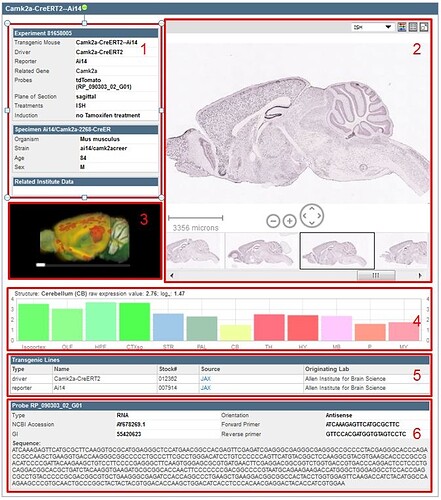
The various sections of the experimental detail page are outlined 1-6 as follows:
- Experimental Metadata: Experiment ID, Transgenic Mouse, Driver, Reporter, Related Gene (click for Adult Mouse data), Probes, Plane of Section, Treatments, Induction; Specimen Data: Specimen ID, Organism, Strain, Age, Sex. Related Institute Data: provides links to related data in other Allen Brain Atlas resources
- Image Viewer : Zoom and Pan Viewer
- 3D Thumbnail Viewer: Rotate using the slider bar under the image
- Histogram: Relative gene expression in large structures of the brain (for stages older than P28). Hovering your mouse over the histogram will sync the image in the single image viewer with the section corresponding to that structure and expression.
- Transgenic Line Metadata: Transgenic lines involved in this experiment including the Type, Name, Stock #, Source (link to provider), and the Originating Lab.
- Probe Information: Probe ID, Type, NCBI Accession, GI, Orientation, Forward Primer, Reverse Primer and Sequence.
Using the Zoom And Pan (ZAP) Image Viewer
The Zoom and Pan (ZAP) Image Viewer is a powerful tool to navigate and view the images in an experiment. The main part of the viewer is an interactive window where an image can be repositioned by dragging with a mouse. Use the scroll wheel, on-screen navigation buttons or the keyboard commands to zoom in or out.
Select other images in the experiment by clicking on a thumbnail image below the main viewer.
Scale Bar
Drag the scale bar with your mouse to the desired location. Click the scale bar text with your mouse to toggle between horizontal and vertical.
Using the ZAP Viewer Toolbar
Use the toolbar to take actions on the image that currently has focus. Toolbar controls include:

Select ISH, Nissl or Expression Energy

Image adjust controls

Display all thumbnail images in a single contact sheet

Open the selected image in the High Resolution Image Viewer
Keyboard Commands
Use the keyboard to navigate through the image series and synchronize the viewers on the page. Keyboard commands include:
You can also use the arrow keys to pan the current image.
Expression Energy
The expression mask image display highlights those cells that have the highest probability of gene expression using a heat map color scale (from low/blue to high/red).

The Expression Energy was calculated as follows: Within a given area A (voxel or structure), expression energy = (sum of intensity of expressing pixels in A) / (sum of all pixels in A):