

Release Notes - October 28, 2025
Genetic Tools Atlas Release 3.0
This release adds more than 750 new datasets including 80+ mouse whole-brain light sheet microscopy images. The release prominently features new tools for labeling cell types in the thalamus, along with expanded basal ganglia resources covering additional regions and cell types. For the first time, macaque datasets are also included, with several exemplary epifluorescence images from Hall of Fame basal ganglia enhancer AAVs labeling striatal D1 and D2 MSNs, OT D1 ICj granule cells, and D1 NUDAP MSNs. Definitions for basal ganglia cell type nomenclature can be found in the Related Resources section below.
Release Notes - March 4, 2025
Genetic Tools Atlas Release 2.0
This release features a new browsing layout and adds over 3,100 new in vivo mouse expression datasets. It includes characterization of several dozen transgenic mouse lines and more than 1,700 adeno-associated viruses (AAVs), representing over 1,000 cortical cell type enhancers and more than 400 basal ganglia (BG) cell type enhancers. Most experiments used retro-orbital (RO) injection for virus delivery; a smaller subset used stereotaxic (STX) or intracerebroventricular (ICV) injections.
Further improvements include:
- Snapshot feature in Neuroglancer.
- Addition of the target cell population for each enhancer AAV (based on maximum chromatin accessibility) within the target brain region. Note that this may be different from the labeled cell population, which represents the experimental result.
- Card view organization of metadata associated with each genetic tool.
- Links for viewing collections of genetic tools via the Allen Institute’s BioFileFinder (BFF). This resource organizes and displays all the visual- and metadata in the GTA, in addition to scRNA-seq data which is currently not included there.
Release Notes - September 17, 2024
Genetic Tools Atlas Release 1.0
This release focuses on enhancer AAVs designed to drive selective gene expression in cell types comprising the basal ganglia. This evolutionarily conserved circuit is composed of several interconnected brain structures, which are critical for motor and reward functions. Dysfunction of this circuit is known to be central to numerous brain disorders including Parkinson’s and Huntington’s disease. Future releases will include enhancer AAVs for targeting various cell populations in other regions of the brain, including cortex, thalamus and the hippocampal formation.
Genetic Tool Types
Enhancer AAVs
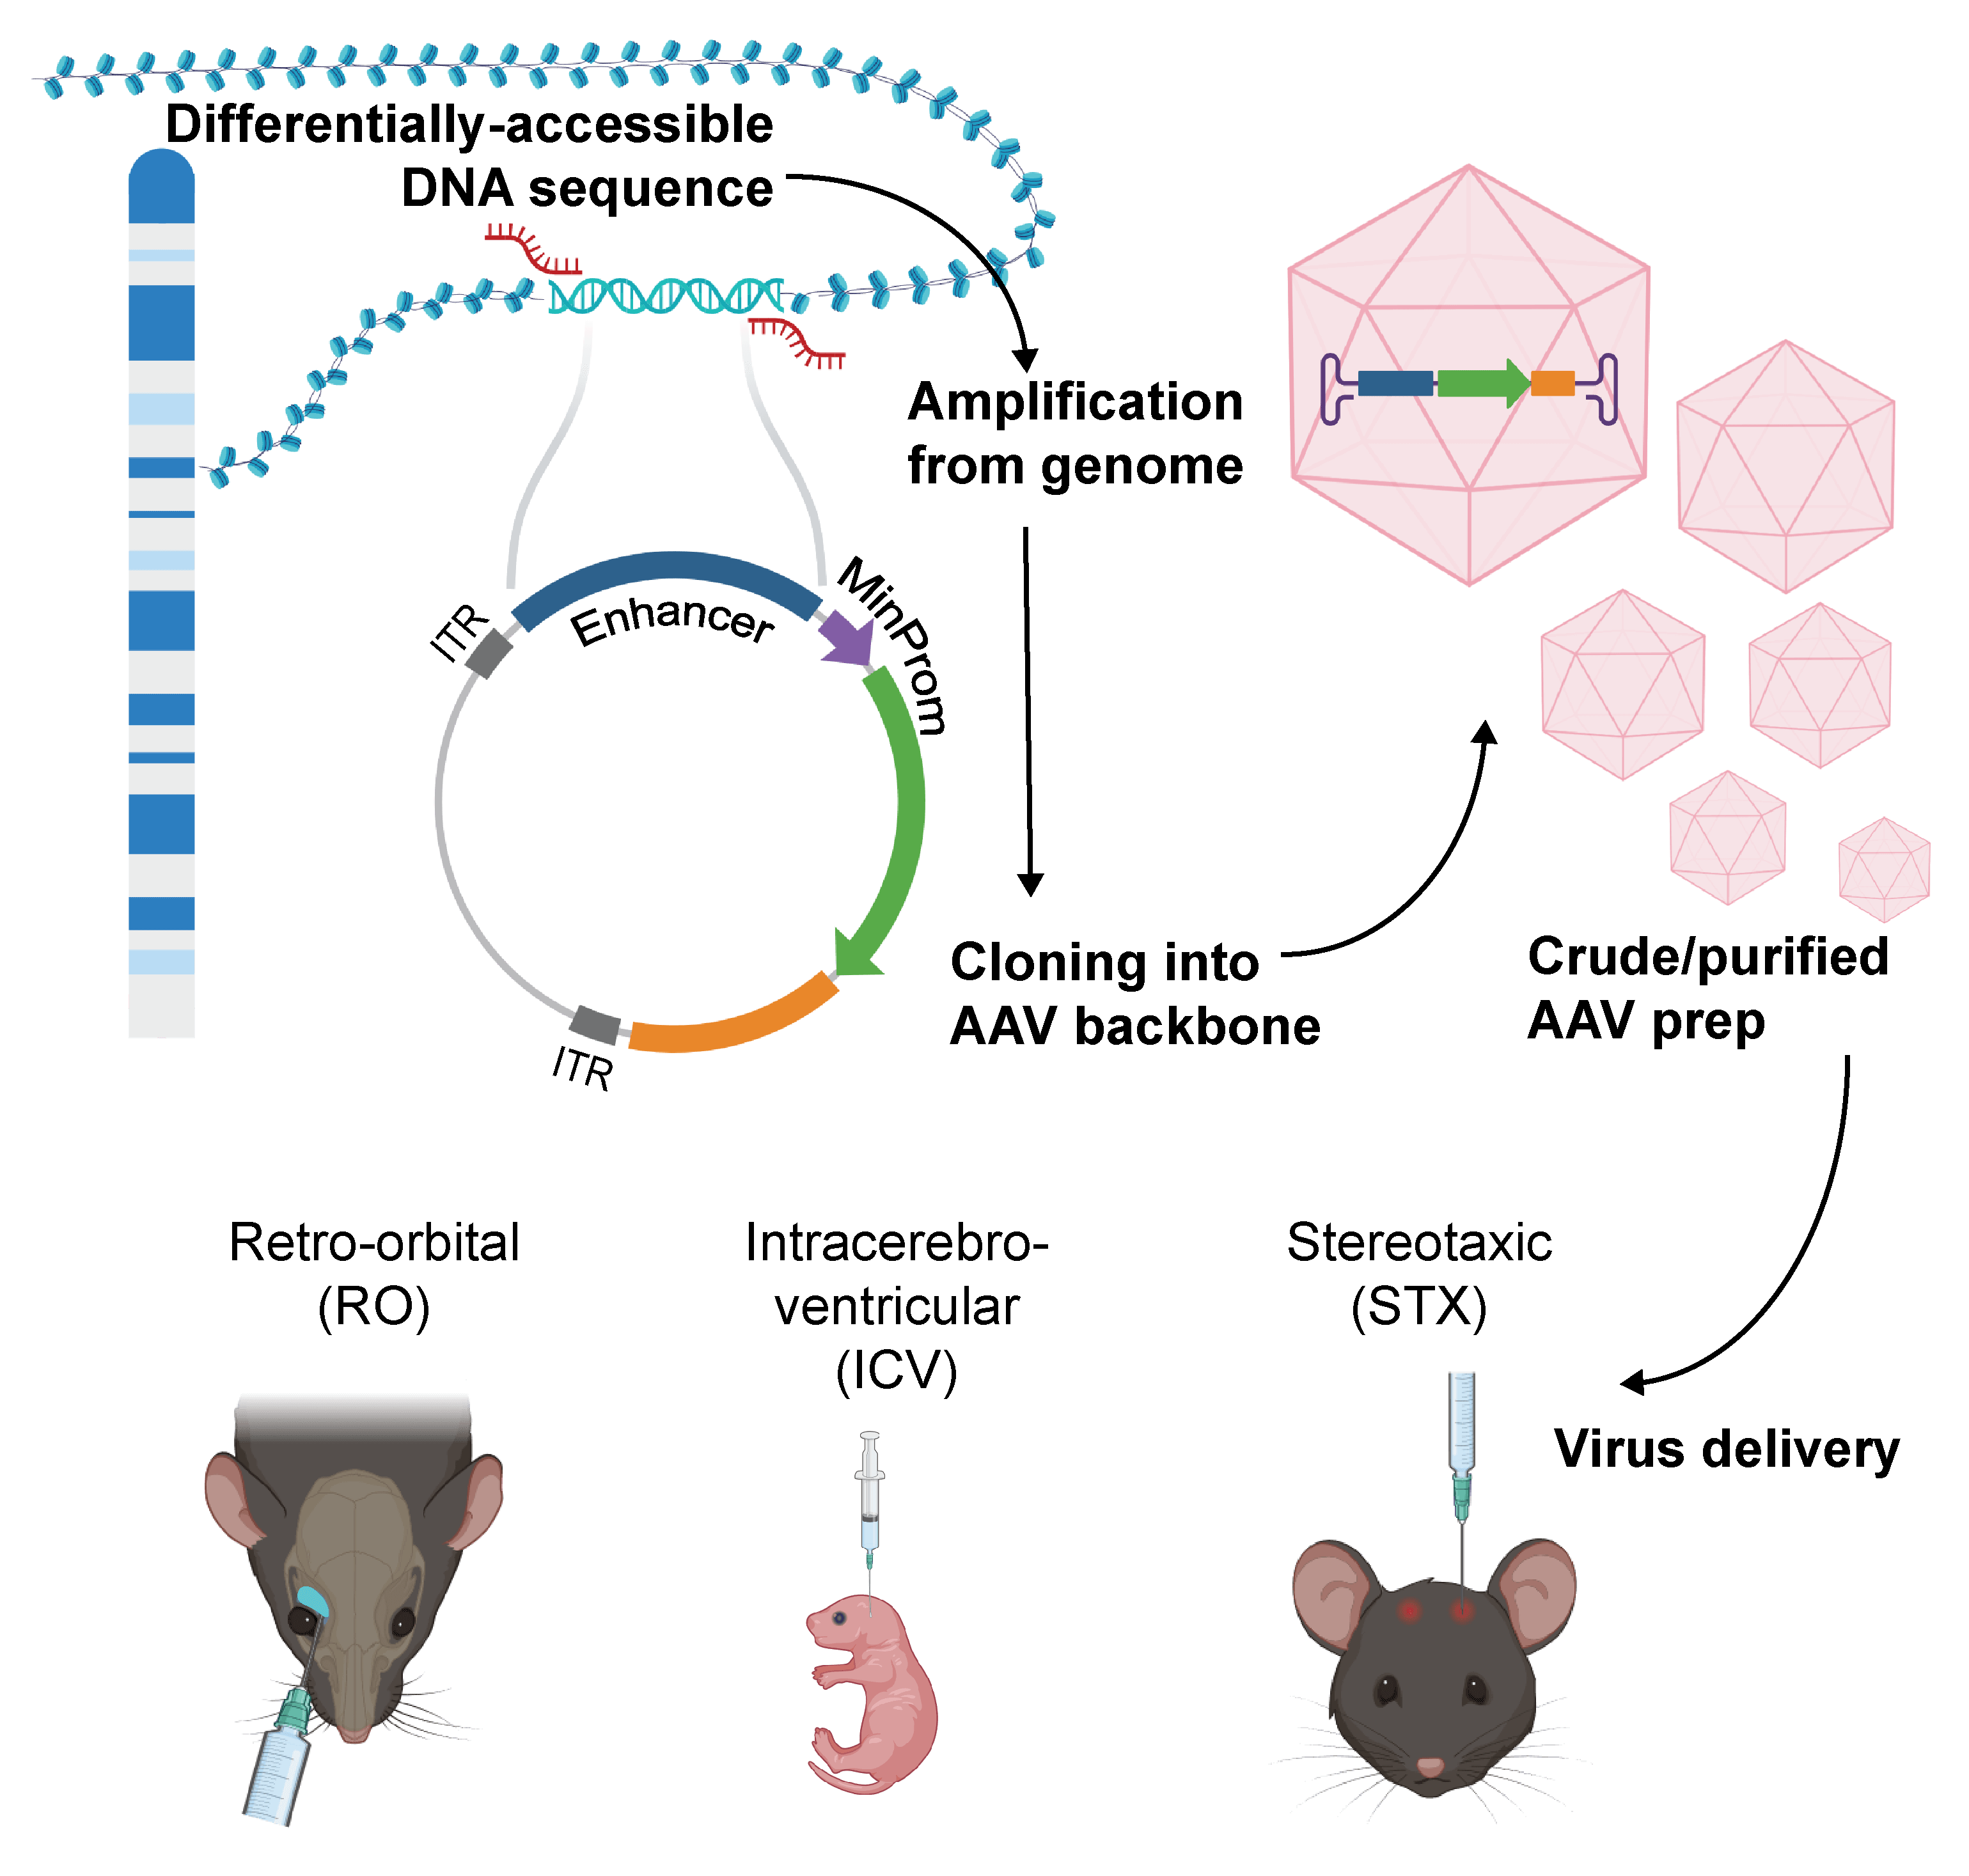
Enhancer AAVs contain short genomic regulatory sequences (enhancers) that, in combination with a minimal promoter, drive expression of a chosen genetic cargo. In our collection, most enhancers were selected from the genome based on their differential chromatin accessibility across different cell types, which is indicative of a possible role in cell type-specific regulation of gene expression. Most of our enhancers were derived from the mouse, human, and macaque genomes and were evaluated following delivery to the mouse brain. We used the retro-orbital (RO) delivery to young adult mice, intracerebroventricular (ICV) to newborns, or stereotaxic (STX) injection to adult mice.
Each Allen institute Enhancer (AiE) is given a unique 4-digit identifier, followed by an indication for the species of origin (mouse (m), macaque (q), or human (h). Some enhancers were bashed into fragments, or “Cores”, and a new sequence was constructed by concatenating each Core three times. These sequences contain a suffix denoting the number of the Core (1, 2 or 3) and the number of times the Core was repeated. Plasmids for enhancer AAV production that have been deposited to Addgene have Addgene IDs. Please reach out to Addgene technical support for availability timelines.
Mouse Transgenes
Transgenic mouse lines are created by inserting an exogenous DNA sequence (e.g. fluorophore, recombinase, or transcription factor) into the mouse genome. Knock-in transgenic mice are usually created by inserting a single copy of exogenous DNA at a specific position, frequently within a marker gene in the genome. This approach takes advantage of the endogenous regulatory elements in the genome to enable selective expression of various transgenes for cell labeling, monitoring, and/or perturbation. The knock-in transgenes frequently produce expected cell-type labeling, which corresponds to the expression pattern of the marker gene, but their efficiency, specificity, and strength, even in the same locus, can vary depending on the exact components inserted. This contrasts with randomly integrated transgenes, where the endogenous elements have been taken out of context and inserted randomly in the genome. Randomly integrated transgenes produce various expression patterns depending on their size, the regulatory elements included, the copy number inserted, as well as the insertion site, which is frequently unknown.
In most cases, transgenes can be classified as drivers or reporters based on the cargo they express. Driver transgenes express exogenous recombinases or transcription factors. Reporter transgenes express easily detectable ‘readout’ (e.g., fluorescent protein) when crossed to a driver. We characterized driver lines by crosses to appropriate reporters (see table below) and imaging with Serial Two-Photon Tomography (STPT). The imaging pipeline generates high-quality images in three channels, often requiring adjustments to visualize signals in the expected channel.
Reporter line name in GTA
Name reported by investigator in Jax
Fluorophore
Color
Recombinase
JAX Stock
Data Modality Summaries
Light Sheet Microscopy
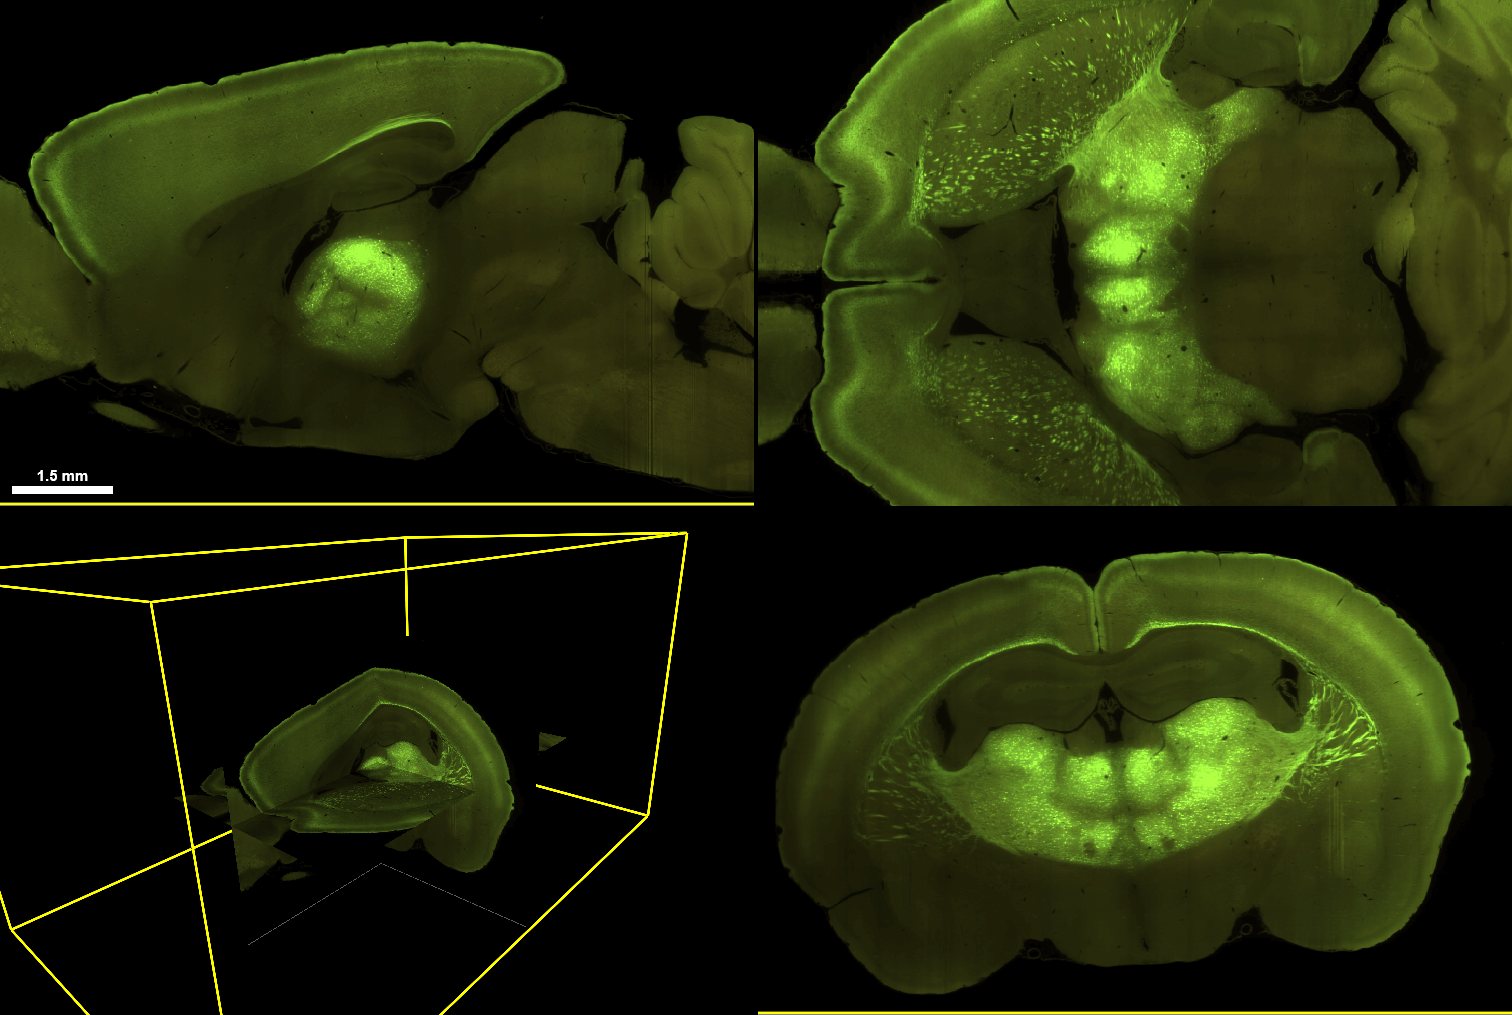
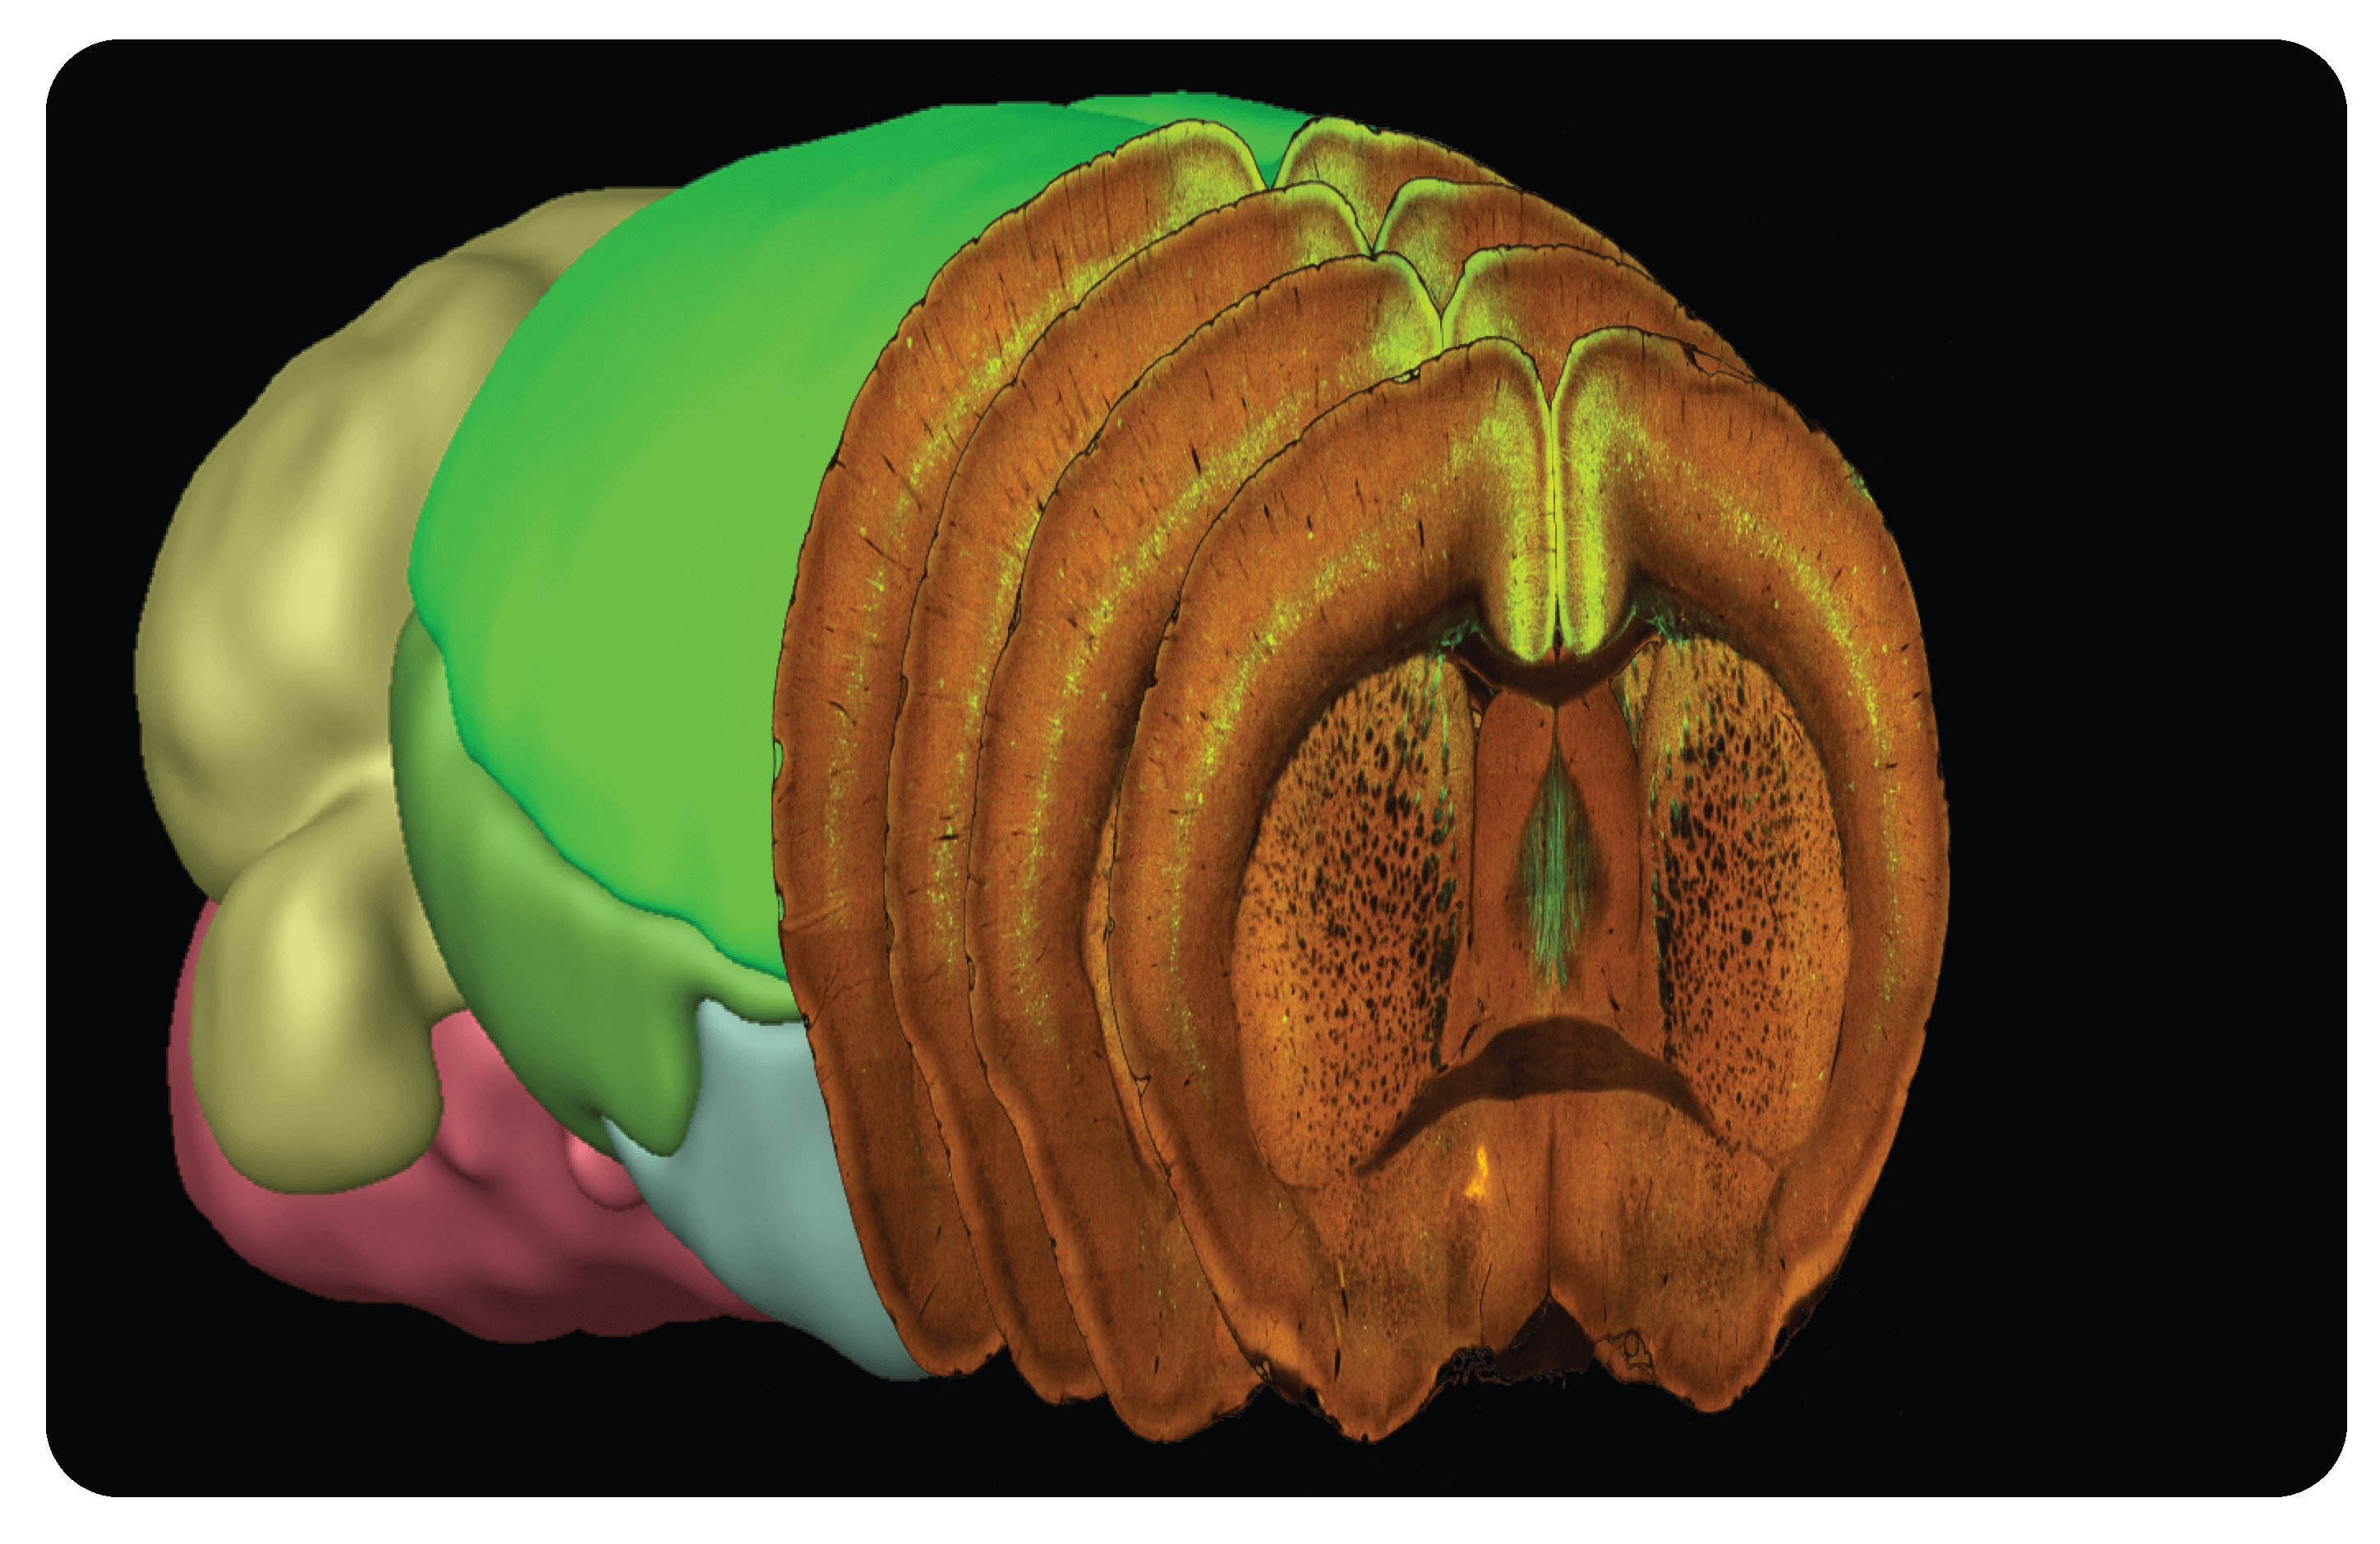
Datasets are produced by axially-swept light sheet microscopy of whole mouse brains using the SmartSPIM (LifeCanvas) platform. Optical sections are formed by a thin plane of excitation light coincident with the focal plane of the detection objective and imaged onto a sCMOS camera. The resulting dataset samples the fluorescence intensity of the entire brain nearly isotropically at voxel size of 1.8 x 1.8 x 2.0 µm^3. These datasets are used for qualitative evaluation of labeling pattern and brightness of enhancer driven fluorescent transgenes, as well as quantitation of targeted cell count and location throughout the brain.
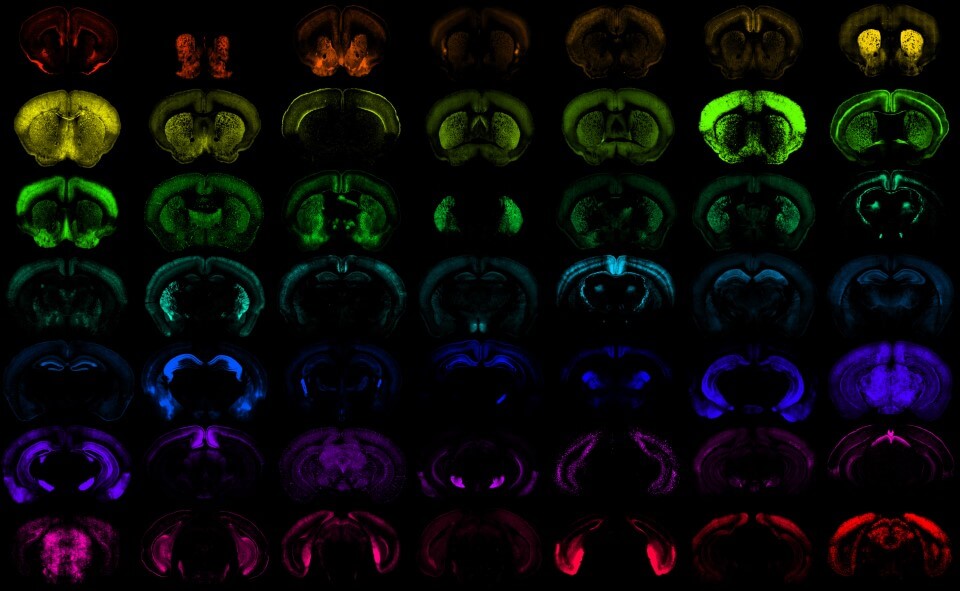
Cell detection and anatomical placement are performed on the full-resolution three-dimensional data. In addition, we generate a series of maximum intensity projections, representing 30 µm of depth at 100 µm spacing, that can be quickly and consistently visually evaluated for overall expression strength and distribution.
Epifluorescence Imaging (EPI)
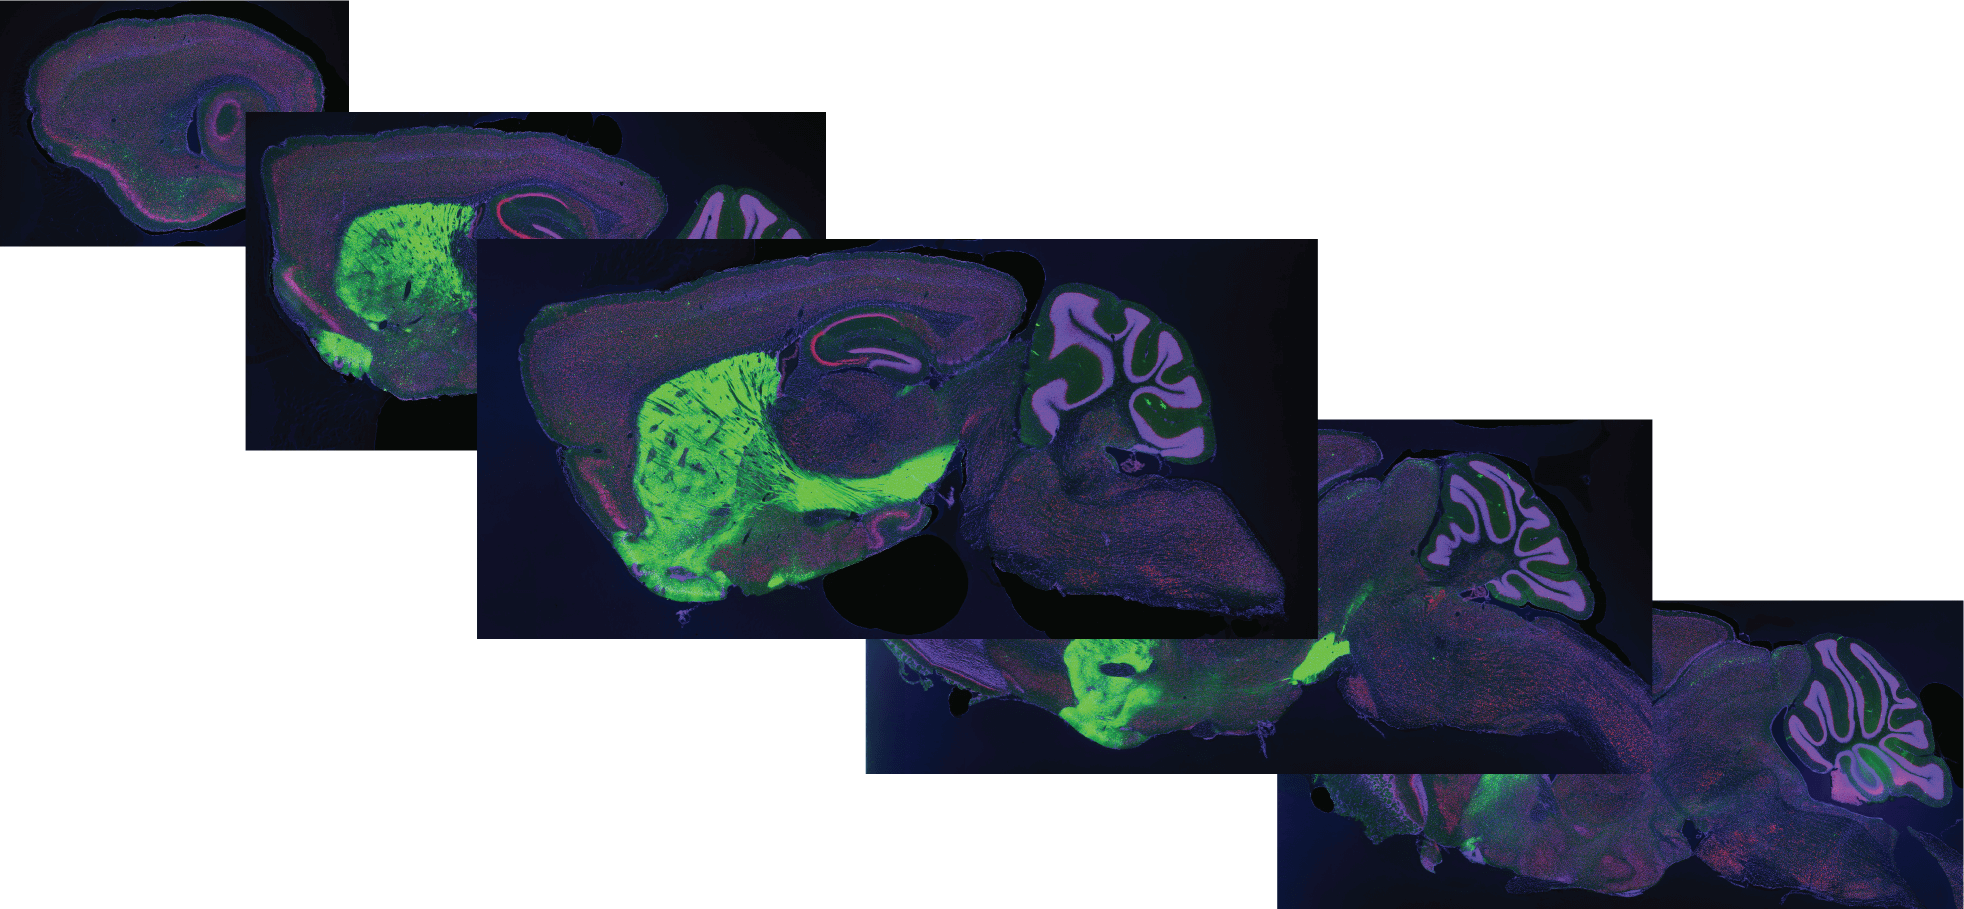
EPI datasets consist of mouse or macaque brain sections, imaged with an epifluorescence microscope. In most experiments, enhancers are used to drive expression of SYFP2 (green), with DAPI (blue) and PI (red) providing nuclear/cytoplasmic counterstain. In mouse experiments where the enhancer drives a recombinase, the signal will depend on the recombinase reporter and the interfering counterstain will be omitted (e.g. if a tdTomato-expressing recombinase reporter was used, PI stain was omitted).
Serial Two-Photon Tomography (STPT)
STPT datasets are produced by serial sectioning of an intact brain at 100 µm-intervals along the coronal plane, followed by two-photon imaging of the exposed surface. The resulting dataset is a series of coronal images at high resolution that enable evaluation of the brain regions and cell populations labeled across the entire mouse brain.
Single Cell/Single Nucleus RNA-sequencing
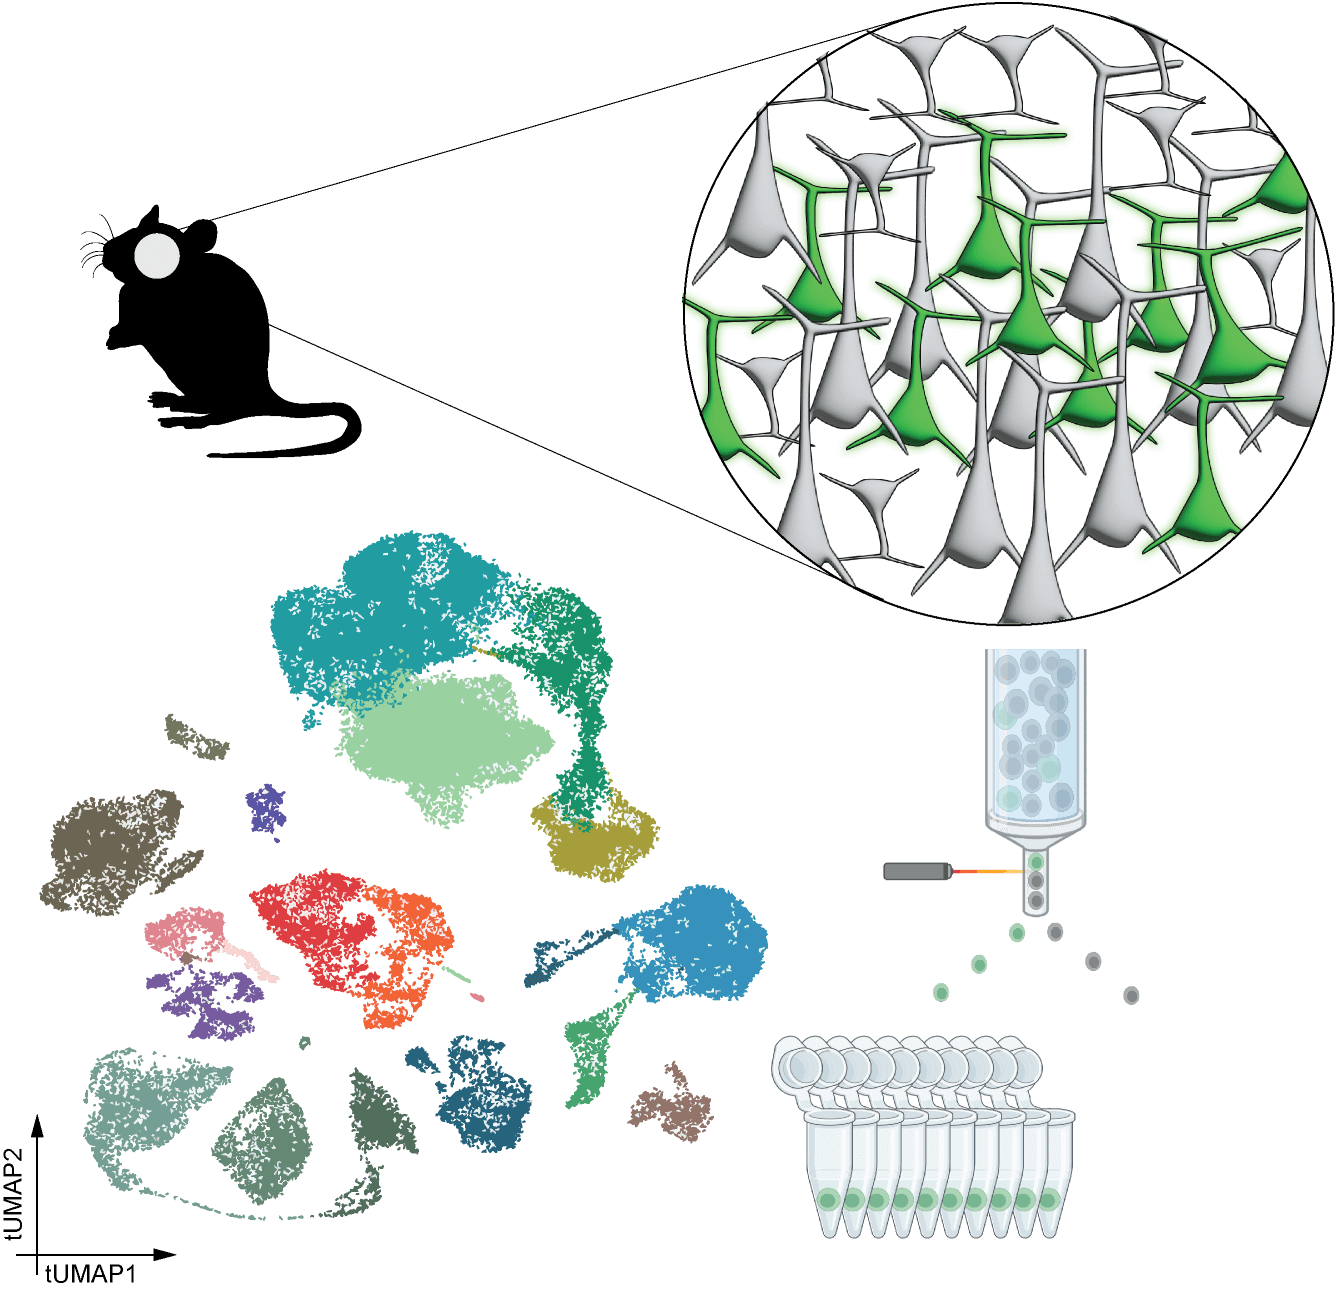
Single cell or single nucleus RNA-sequencing (sc/snRNA-seq) is used to determine the transcriptomic identity of labeled cells. In this approach, following virus administration, a region of interest (ROI) is dissected, and the tissue is dissociated for isolation of individual labeled cells/nuclei with FACS. After RNA-sequencing with Smart-seq v4 (SSv4) and next generation sequencing, the transcriptome of each cell is mapped to the transcriptomic cell type taxonomy most relevant to the dissected ROI. The proportions of cells/nuclei mapped to each of the region’s cell types are determined. This approach provides a detailed transcriptomic characterization of the labeled cells, but it can be prone to biases, which stem from the relatively small number of sequenced cells, as well as differential sensitivity of cell types to the dissociation and sorting process.
Related resources
Citations
- Genetic Tools Atlas (RRID:SCR_025643)
- Gray LT et al., Elife. 2017 Layer-specific chromatin accessibility landscapes reveal regulatory networks in adult mouse visual cortex. DOI: 10.7554/eLife.21883
- Mich JK et al., Cell Rep. 2021 Functional enhancer elements drive subclass-selective expression from mouse to primate neocortex. DOI: 10.1016/j.celrep.2021.108754
- Graybuck LT, Daigle TL et al., Neuron. 2021 Enhancer viruses for combinatorial cell-subclass-specific labeling. DOI: 10.1016/j.neuron.2021.03.011
- Mich JK et al., bioRxiv [Preprint]. 2023 Enhancer-AAVs allow genetic access to oligodendrocytes and diverse populations of astrocytes across species.DOI: 10.1101/2023.09.20.558718
- Ben-Simon Y, Hooper H, Narayan S, Daigle TL et al., Cell 2025 A suite of enhancer AAVs and transgenic mouse lines for genetic access to cortical cell types. DOI:10.1016/j.cell.2025.05.002
- Hunker A, Wirthlin M et al., Neuron 2025. Enhancer AAV toolbox for accessing and perturbing striatal cell types and circuits. DOI: 10.1016/j.neuron.2025.04.035
- Hunker AC et al., bioRxiv [Preprint]. 2025 Technical and biological sources of noise confound multiplexed enhancer AAV screening. DOI: 10.1101/2025.01.14.633018