ABC Atlas User Guide
The ABC Atlas aims to empower researchers worldwide to explore and analyze multiple whole-brain datasets simultaneously. As the Allen Institute and its collaborators continue to add new modalities, species, and insights to the ABC Atlas, this groundbreaking platform will keep growing, opening up endless possibilities for groundbreaking discoveries and breakthroughs in neuroscience. With the ABC Atlas, researchers everywhere can gain new insights into the brain’s complex workings, advancing our understanding of this amazing organ in ways we never thought possible.
In addition to incorporating new data regularly, the ABC Atlas will continue to be updated every few weeks with new features and capabilities. Please let us know what you like, what you don’t like, and what you’d like to see in future updates!
Overview
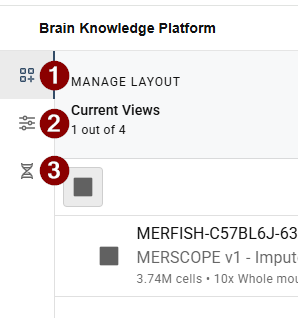
The icon panel on the left allows quick navigation between Control Panel tabs. The filters and settings on each tab all work together to change what is displayed in the visualization frames to the right.
There are three tabs, each controlling a different aspect of the visualizations:
- Manage Layouts - Find data to add to your view or change your layout
- Cell Properties - Filter and color by data features and values
- Genes - Search, select, and color by gene expression
Manage Layouts & Browse Data Sets
The Manage Layout tab allows adding, changing, and reordering visualization frames. Frame settings like point size and transparency can also be accessed here.

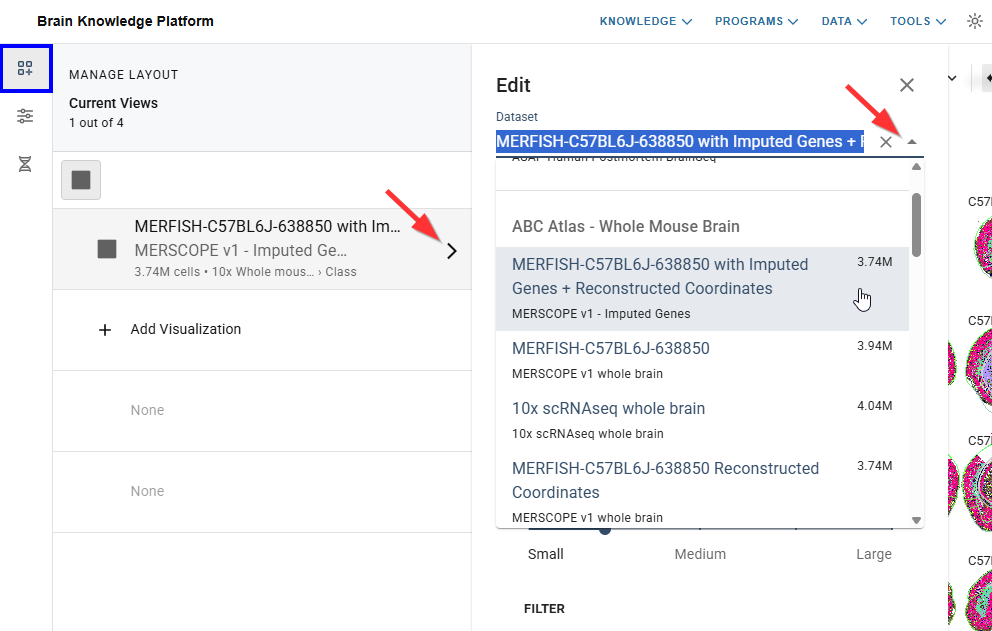
Adding and changing views
- To add a new visualization click the + icon in an open row.
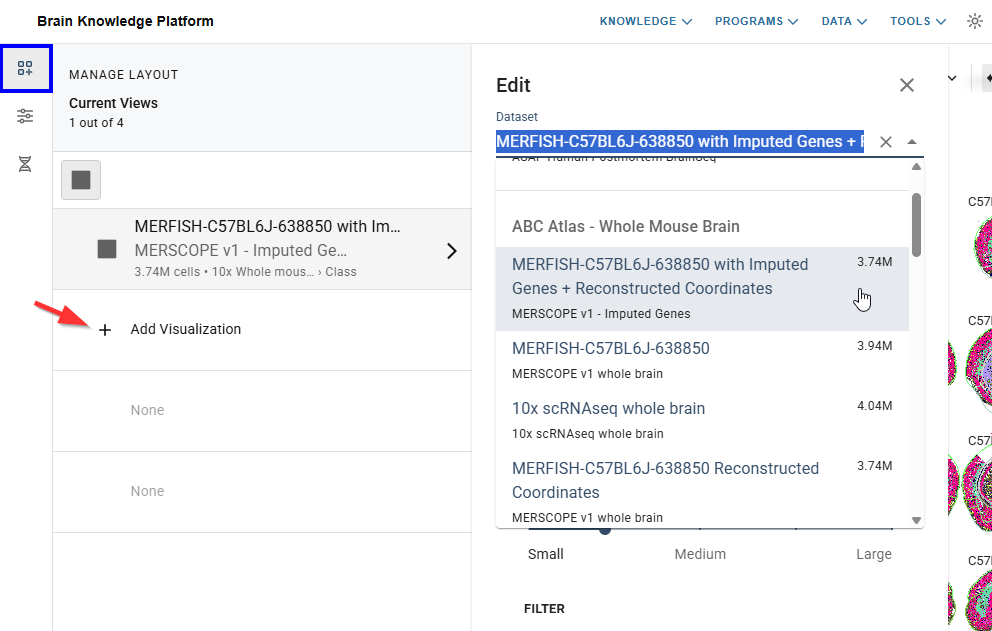
- When adding or changing a view, the data set can be selected using the dropdown list in the pop-out menu
- The layout orientation can be changed by clicking the icons at the top of the panel. Change the order of views by dragging and dropping a row in the list.
Settings
Resolution/Performance
The balance between resolution quality and rendering speed may be adjusted using the Resolution/Performance slider in the Settings tab. In order to dynamically render the millions of points in our data sets, we use a sophisticated sampling algorithm that trades off speed for resolution when zoomed out. Depending on system set up, the data being viewed, and exploration goals, the slider may be used to increase speed and reduce resolution or vice versa.
The same setting may produce different results with different data sets or different system setups. We encourage you to experiment with the settings to find the one that works best for your needs
Please note:
Your device, internet connection, browser, and other factors can influence performance and loading speed. For best results, we recommend using the ABC Atlas in an updated version of the Chrome browser and closing unnecessary programs and browser tabs. If you experience significant performance issues, please let us know using the feedback survey and include your system details.
Point Size
The size of the points (cells) in the visualization frame can be changed in the Settings tab. Move the Point Size slider to the left for smaller points (for less overlap) or to the right for larger points (for denser visualizations). Points will dynamically resize as you zoom in or out relative to the size selected.
Transparency
- If a filter has been applied to your visualization, you may adjust the prominence of the unselected cells.
- To change transparency, navigate to the Settings tab within the Control Panel and click the checkbox and adjust the slider to change the opacity.
- Setting the transparency to the lowest level will remove the unselected cells completely.
Cell Properties
To learn more about the selected data set including download links, sharing, and citation tools, click the (i) icon next to the data set name.
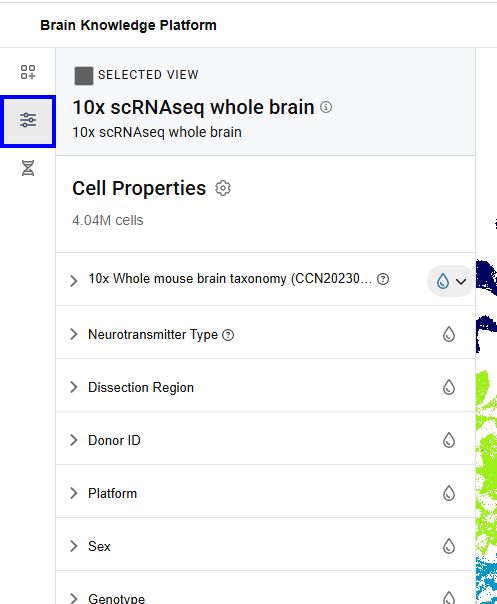
Color
- You may apply color to your visualizations to help distinguish cells within a category or gene expression.
- Color values are predetermined and may only be applied to one feature at a time.
- Click the droplet icon to the right of a feature to color by that feature. The currently colored feature is indicated by a gray circle highlighting its droplet.
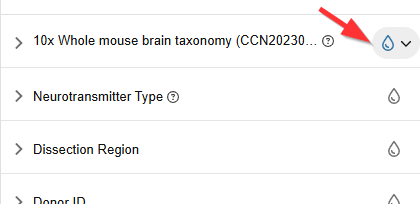
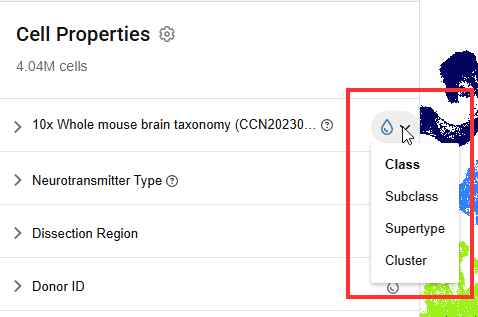
- For hierarchically nested features, the droplet will have a small arrow to the left. Click the arrow to display a dropdown menu with additional coloring options.
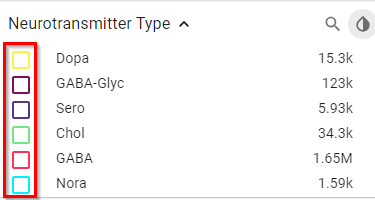
- If color has been selected for a feature, the checkbox next to its sub-values will change to reflect each value’s corresponding color in the active frame.
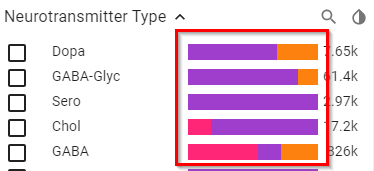
- When you color by a feature, values under the other features show the distribution of cells in the next lower level of the hierarchy as a horizontal bar next to that value. When a filter is applied, only the selected values(s) will display this bar.
Filtering
- Color may be applied to a subset of cells in the visualization using filters.
- Multiple filter selections within a feature will include any cells that meet either criterion (OR), while multiple filter selections across features will only display cells meeting all criteria (AND).
- When no filters are selected, the total number of applicable cells appears next each value within a feature. Once a filter has been applied, only the selected values will show cell counts, other unselected values will display zero.
- To filter cells from your active frame, check the box next to a value you wish to see colored. Cells with any other value within the feature will be grayed out. See notes on Transparency to adjust the opacity of these filtered-out cells.
- When filters have been applied, a gray badge appears at the top of the feature section indicating the number of active filters. To remove all selected filters, click the “x” in the gray badge.
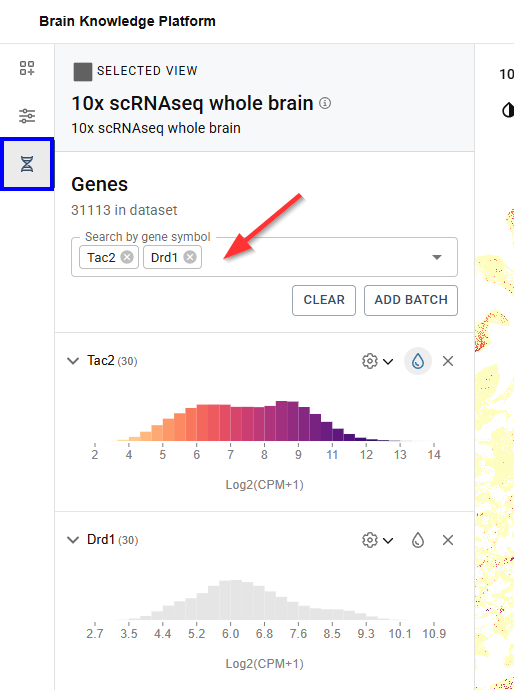
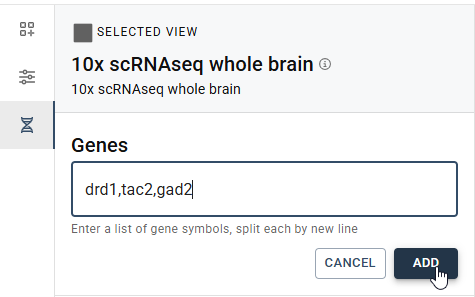
Genes
On the Genes tab, search and select multiple genes in the search bar or use the Add Batch button to add a list of genes all at once.
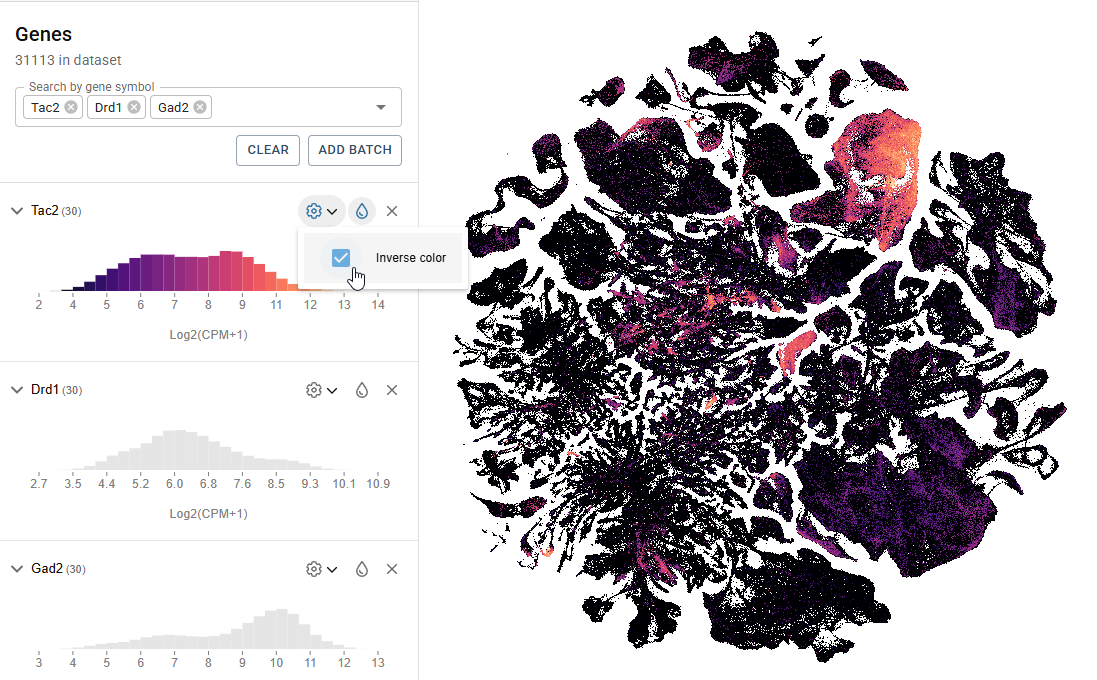
Gene Expression Settings
To invert the color map, click the gear icon and check the “Inverse color” box.
Gene Expression Filtering
To filter views by gene expression value, from the Genes tab, after selecting a gene, click on the gene name to show the expression histogram. Click anywhere in the histogram to initiate filtering, then click and drag the vertical bars to adjust the values shown in your filter. Only one numeric feature filter is allowed at a time. To remove the filter, click the eraser icon to the right of the gene name.
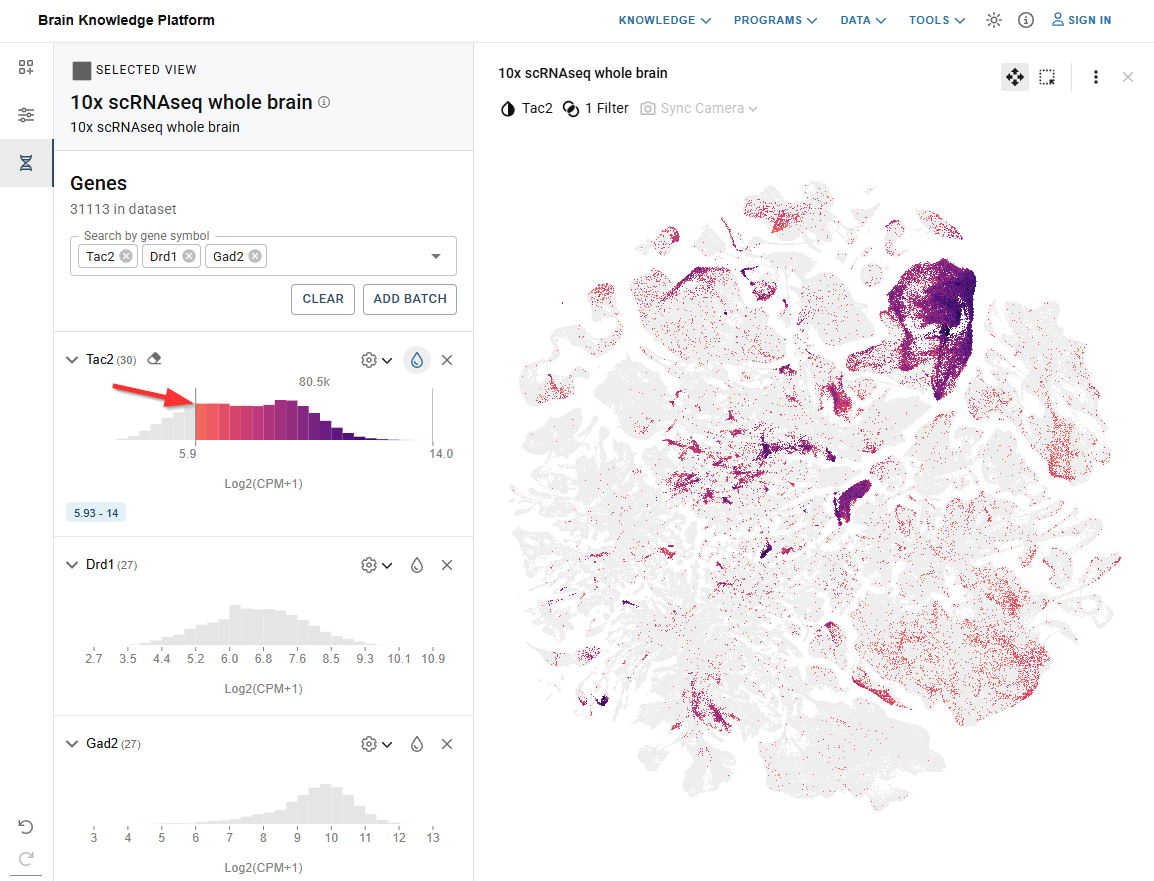
Tip: You can filter by gene expression values while coloring by a different feature, including other genes.
Share and Citation
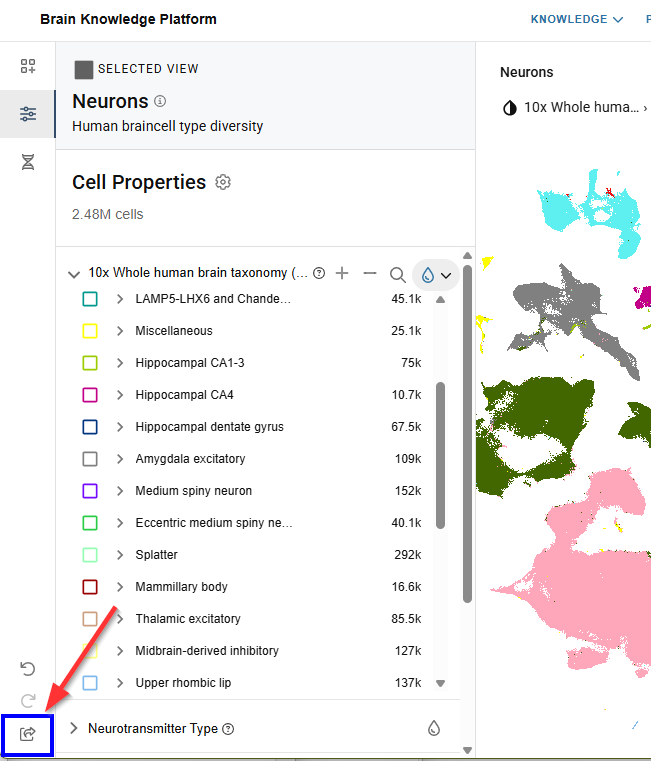
Share
Click the icon in the lower left to copy a link to the current set of visualizations. The link saves the state of all views including, filters, colors, and camera positions and can be shared with others or saved for future reference.
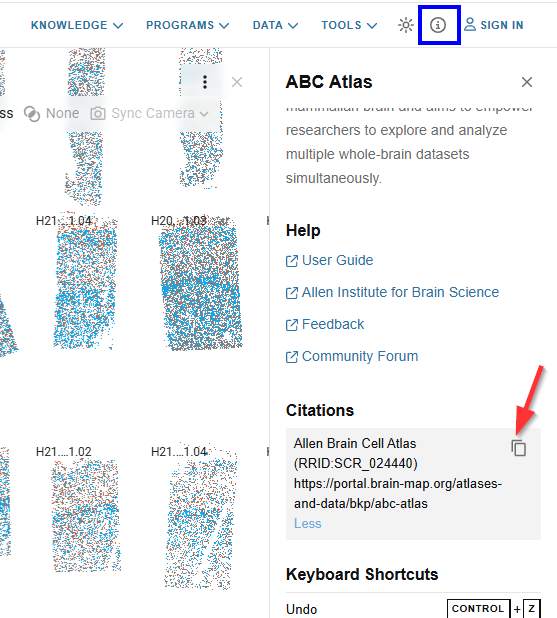
Project Citation & ABC Atlas Tool Citation
To cite the ABC Atlas tool click the info icon in the top navigation bar then click the copy icon under Citations in the right panel.
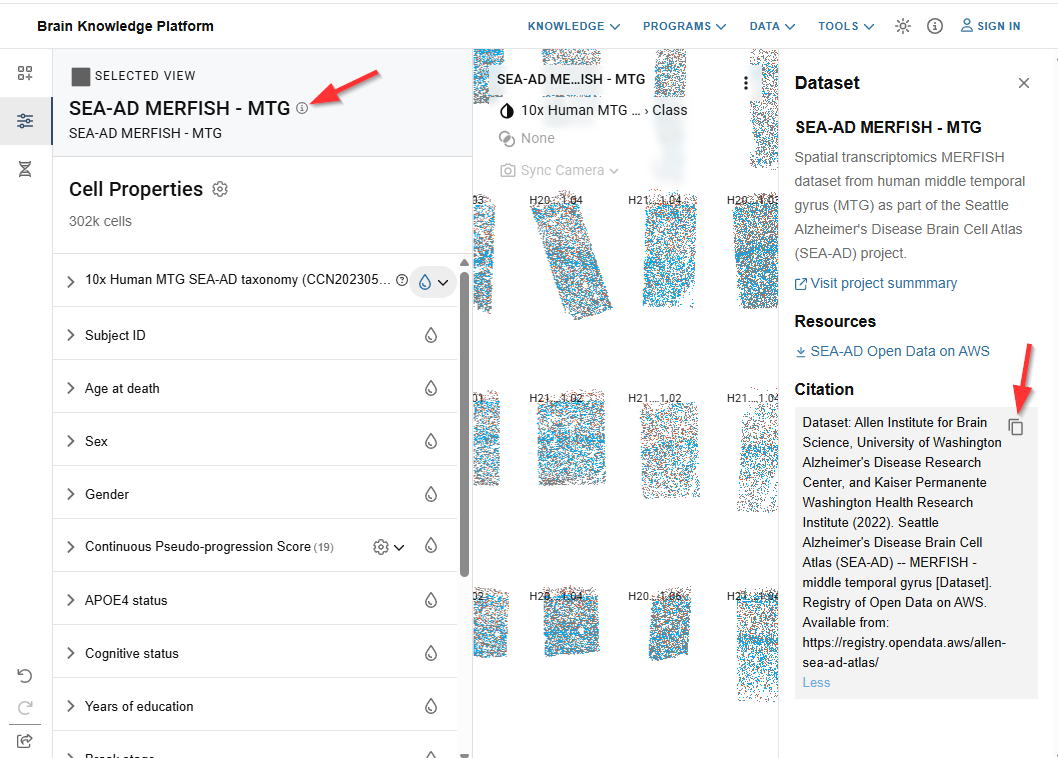
To cite the data displayed in ABC Atlas click the Dataset info icon then the copy icon under Citation in the right panel.
Visualization Frame
The ABC Atlas allows you to view up to four visualizations at the same time. When viewing multiple visualizations, the active frame is indicated by a bold outline. Only the active frame will be affected by selections made in the Control Panel.

Tool tips
Hovering your mouse over a cell will display details of the cell’s color. For example, if your visualization is colored by Class, hovering over a cell will show which class the cell belongs to. If multiple cells overlap, the most common cell in the area will be shown.
If the data supports anatomical overlay, the tool tip will also show which anatomical area the cell is in.

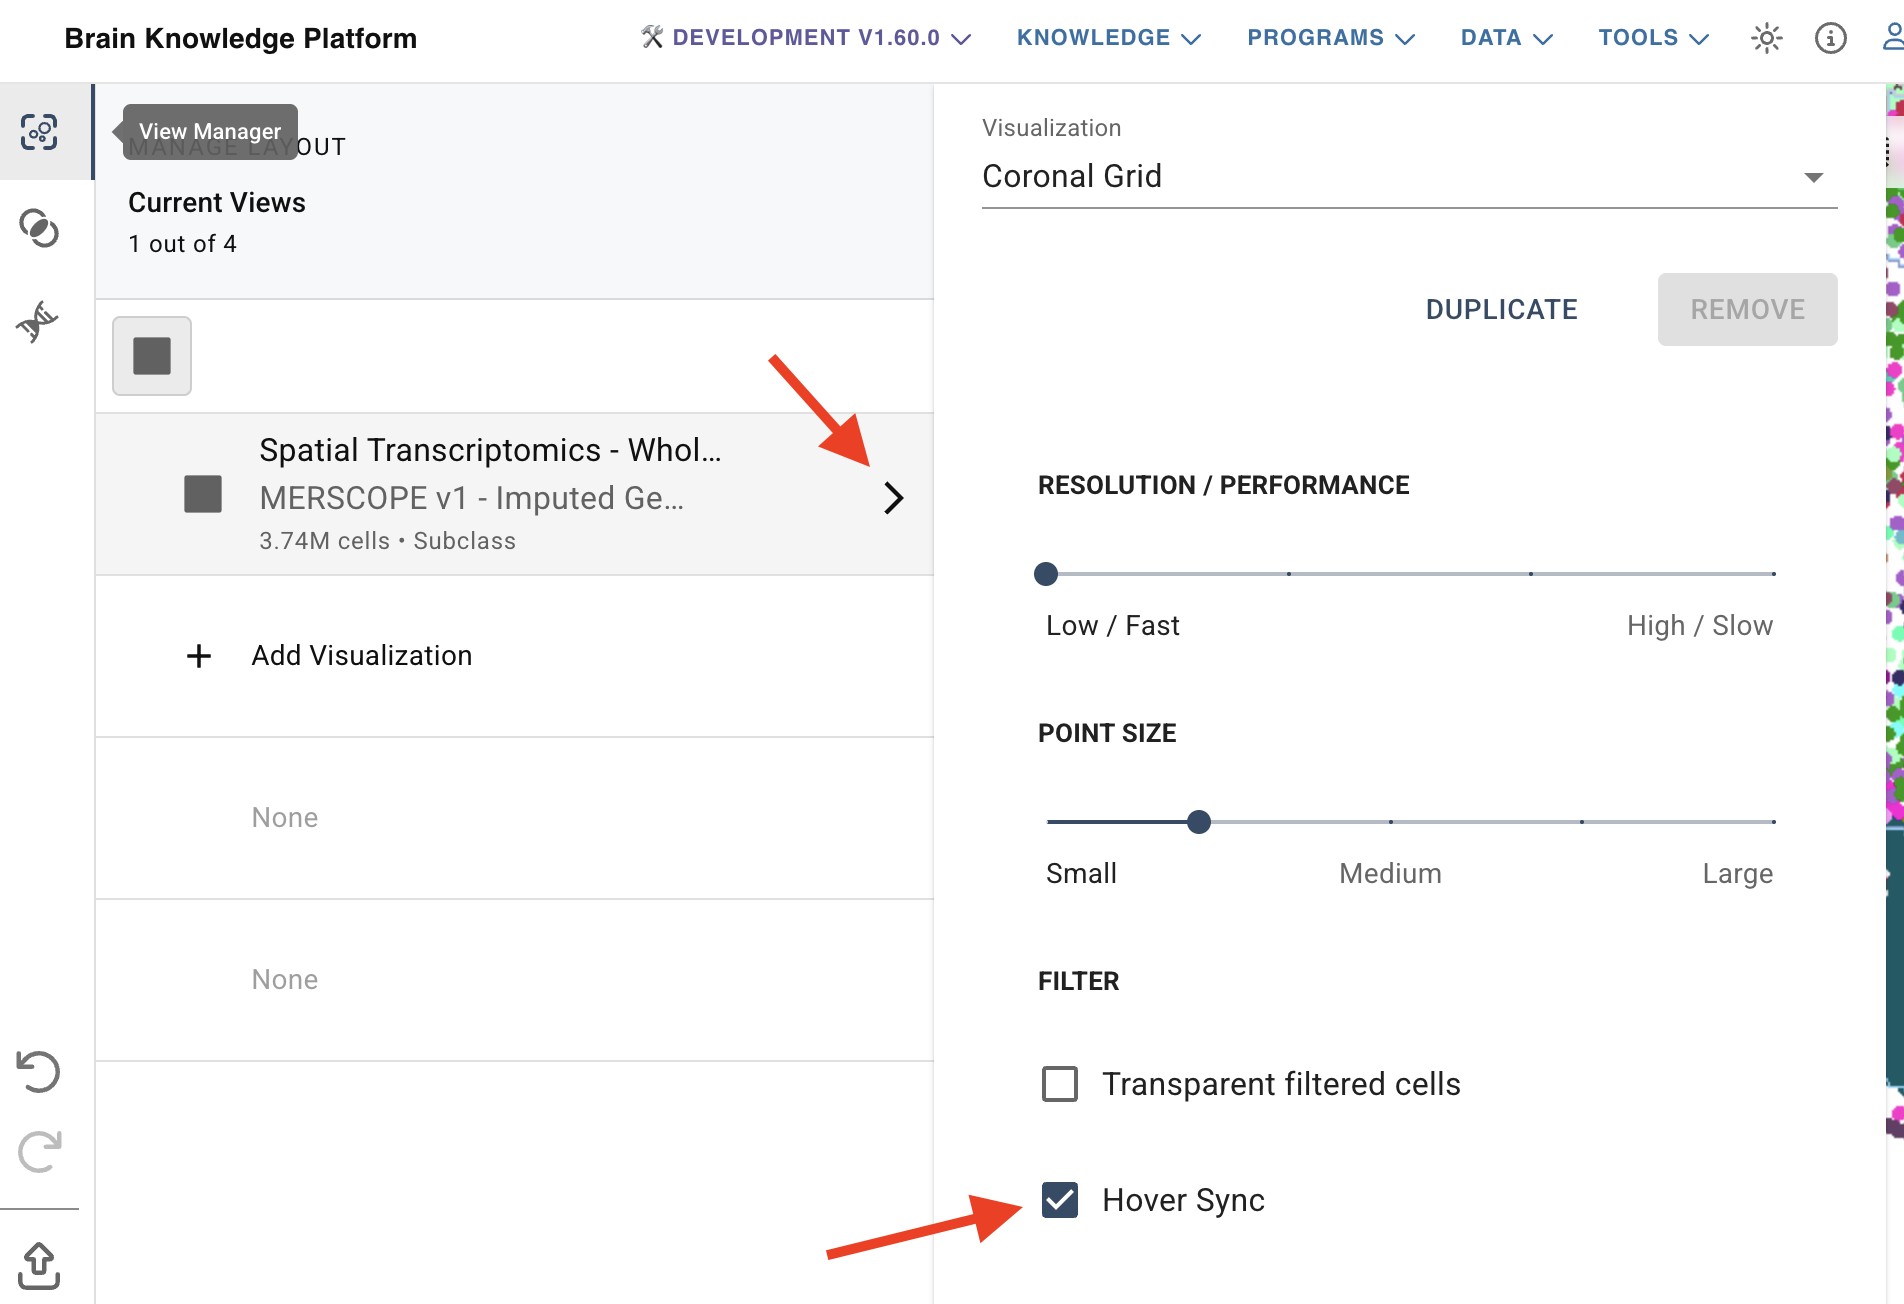
Hover Sync
The “hover sync” is a feature that allows you to quickly see and compare cell property values which are shared across data sets.
When hovering over a cell in addition to the cell property displayed in the tool tip, other cells in the view temporarily increase in size to show where else that value occurs. If other views are open with cells that share that value, those cells will also temporarily increase in size.
For example, when viewing the Zeng and Zhuang whole mouse brain data sets side by side and coloring by cell type in both views, hovering over a cell type in one view will highlight the same value in the other view.
This same cross-view highlighting can also be achieved by hovering over a value in the cell properties left tool bar.
To turn this feature off for the selected view, uncheck the Hover Sync box in the settings.
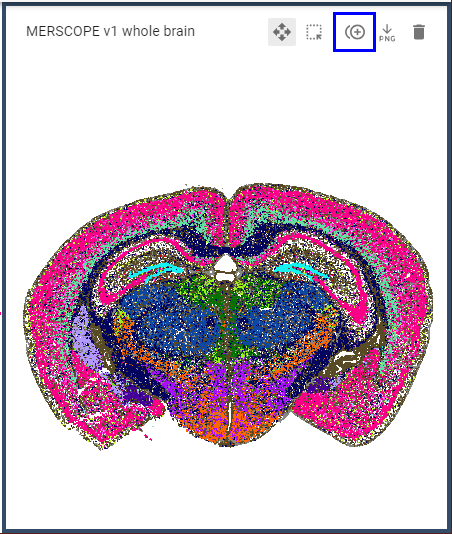
Duplicate View
In the top right of the selected view, clicking the third icon from the left will create a new view with the same colors, filters, pan, and zoom settings as the active view.
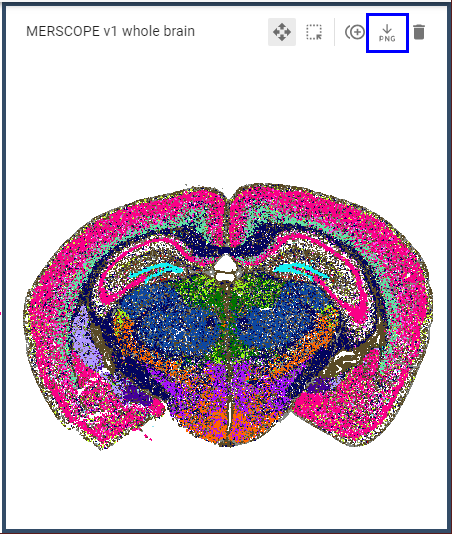
Download image
This creates a high-resolution PNG image of the selected view and initiates the download through your browser.
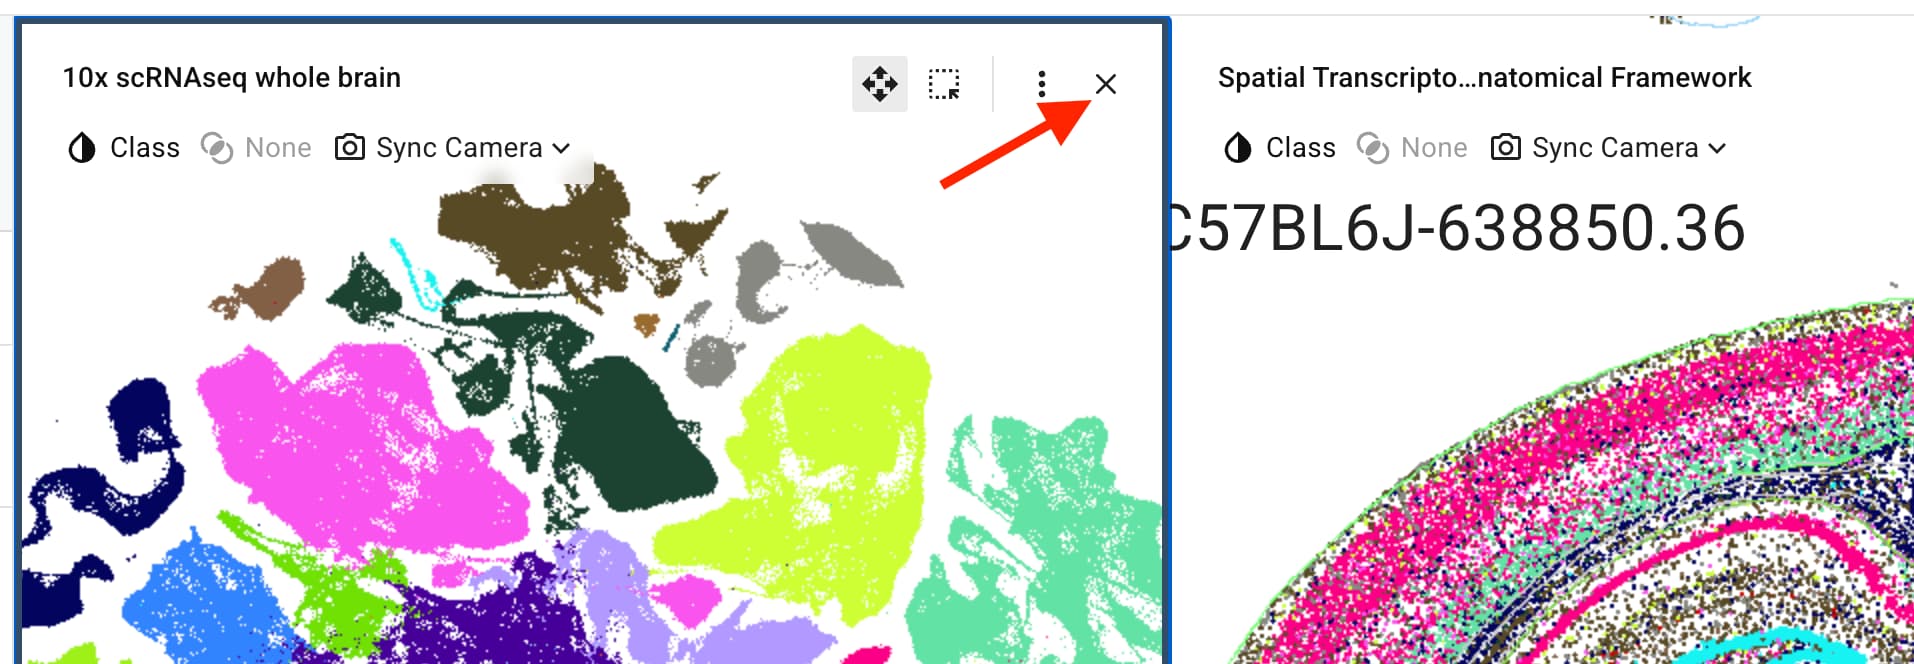
Close
Click the X in the upper right of the active frame to remove it from your layout.
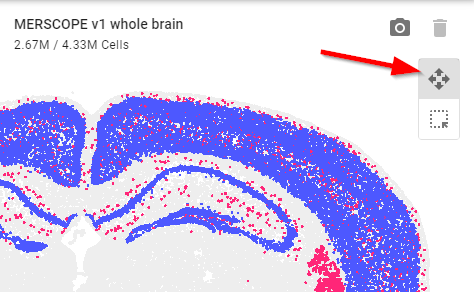
Navigation modes
- ABC Atlas allows two navigation modes, Zoom & Pan or Cell Selection. The active navigation mode is indicated by and can be changed using the icons in the top right of the active frame. Only one navigation mode is active at a time.
- Zoom & Pan is indicated by four arrows and Cell Selection is indicated by the perforated square.
Camera Controls (Zoom & Pan)
- Use your mouse scroll wheel to zoom in to view more detail or out to see more of the visualization at once.
- Click and drag to view a different area of the visualization.
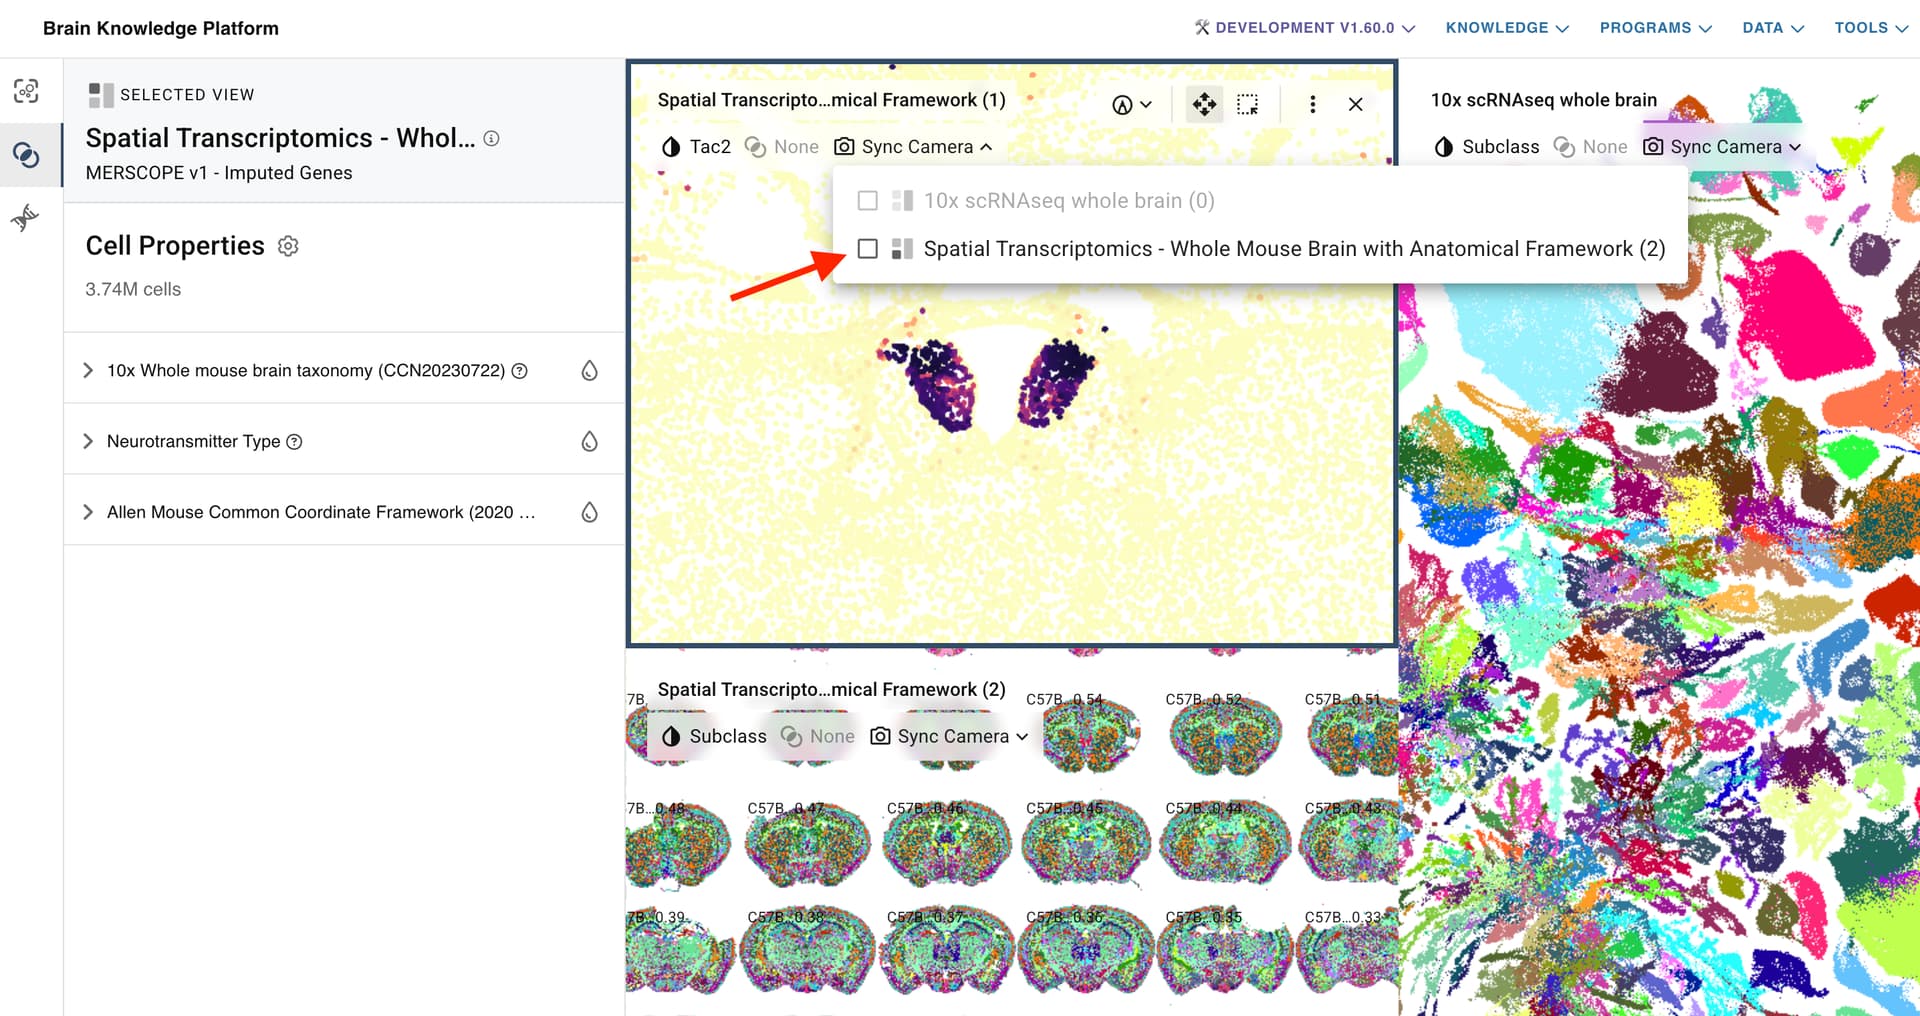
Camera Syncing
Camera Syncing creates spatial sync groups between views of the same data set, allowing you to control two or more views at once. When syncing is enabled, as you zoom in or move the “camera” in one view, synced views will follow, maintaining the same position. Syncing does not affect selected filters or colors so that you can compare different features in each view.
- To initiate Camera Syncing, click Sync Camera in the top right of the selected view.
- Check the box next to the view you’d like to sync with.
Now any change made to the zoom or pan state in one view will also be reflected in the other view.
Enabling syncing for additional views of the same data will add them to the original sync group. Note: Only one sync group per data set is supported.
- Unselect the checkbox to remove a view from the sync group and allow the camera for that view to be controlled independently.
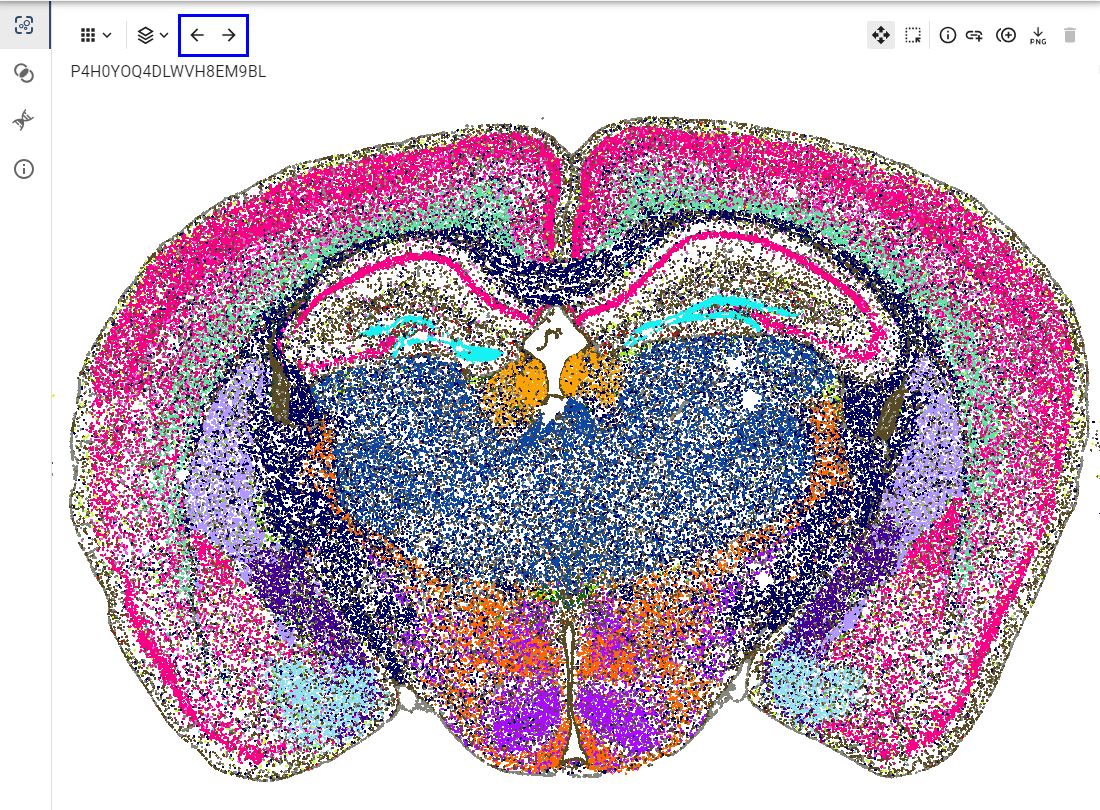
Slide View
Data sets comprised of spatial slices of tissue offer additional viewing options including the ability to scroll through slices while maintaining zoom and pan positioning.
- Advance through slices in order using any one of the following mechanisms:
- use the arrow buttons at the top of the view
- simultaneously hold the Alt key on Windows (Option key on Mac) and scroll the mouse wheel
- hold the Alt key on Windows (Option key on Mac) and press the arrow keys
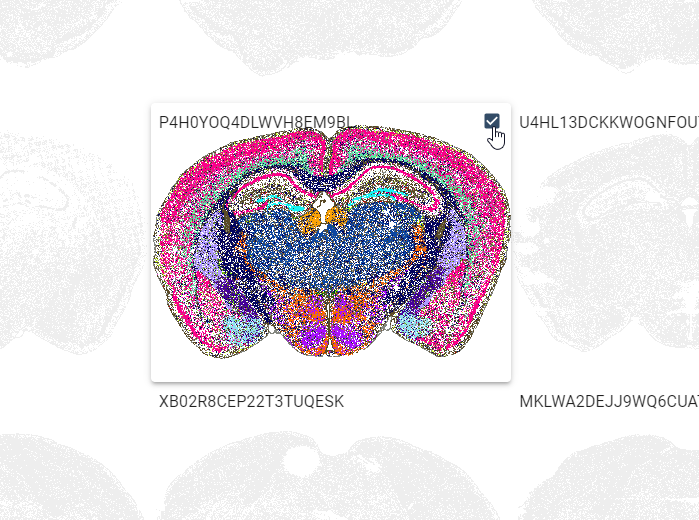
- Show or hide specific slices to create a custom view by checking the box in the upper right hand corner of each slide to be shown.
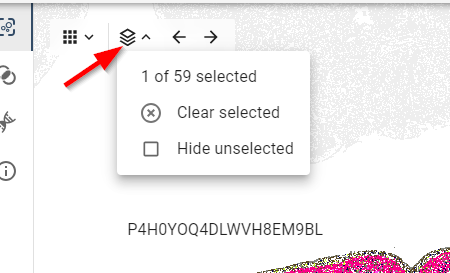
- To completely hide unselected slices, click “Hide unselected” from slide menu in the top left of the view.
- Pick “Clear selected” from the slide menu in the top left of the view to clear all selections or uncheck all boxes.
Cell Selection
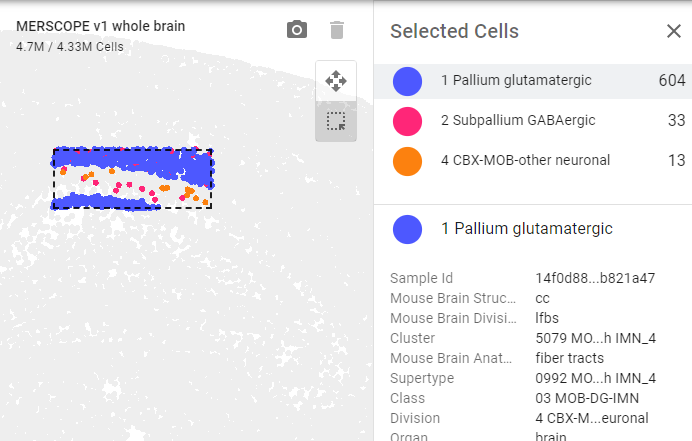
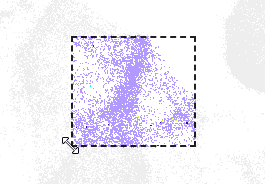
- In Cell Selection mode, click and drag to highlight cells in a specific region of the visualization to open the Selected Cells panel.
- Once cells have been selected, the top portion of the Selected Cells panel displays an aggregated view of the cells in your cell selection region grouped by your current color selection.
- The bottom portion displays the details of each cell in the highlighted aggregation group. Click on a different aggregation group in the top section to switch groups.
- Press the shift key once to enter Cell Selection mode. Press shift again to exit.
- Zoom & pan controls will continue to work even when in Cell Selection mode. Use the scroll wheel to zoom and hold the space bar to pan.
- When in Cell Selection mode, the selection box can be resized by hovering over the edge until the cursor becomes a double-sided arrow and then clicking and dragging to the desired size.
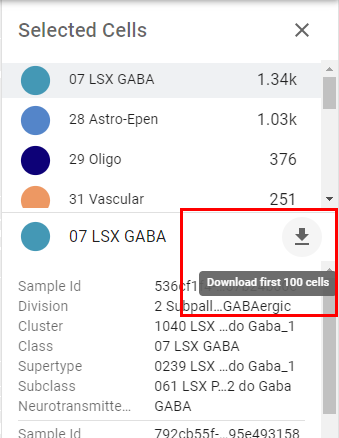
- While in the Cell Selection view, details of the selected cells can be downloaded as a csv file. Please note, only the first 100 cells will be included in the download. Full dataset download is available via GitHub .
- Use the Zoom and Pan mode to focus in on the desired region of cells
- Switch to Cell Selection mode and drag to select a specific set of cells
- In the Selected Cells list, click on a aggregation group value
- Click the arrow icon to initiate the download
Header
Light/Dark Mode - Toggle between light and dark color scheme by clicking the moon icon.

Help - Access information about the ABC Atlas including documentation, our community forum, and provide feedback and suggestions to help us improve your experience.

Give us your feedback and suggest new features here: Allen Institute - Feedback