Allen Developing Mouse Brain Atlas In Situ Hybridization ISH Data
Viewing Gene Expression Data
The Allen Developing Mouse Brain Atlas offers colorimetric In Situ Hybridization data at cellular resolution at seven stages of mouse development. Choose among the following options for retrieving the data:
- Search from the tag cloud by Gene Classification
- Use Gene Search to locate genes’ data by name, symbol, NCBI accession number, or Entrez Gene ID.
- You can also use Gene Search with Boolean operators on specific field names using Boolean Syntax Query.
- Search for manually curated enhanced gene expression data using the Annotation Search.
- Search for genes with enhanced expression by anatomic region using Anatomic Search.
- Search for genes with enhanced expression by developmental stage using Temporal Search.
- Explore related studies using the Extended Studies radio button.

Gene Search
To search for a specific gene by name, symbol, NCBI accession number, or Entrez gene ID, type your query into the text box, making sure the “Gene Search” radio button is selected. As you type, genes that match your search string will be suggested to you. Select an item from the list and click the “Search” button. The results are displayed in a list that shows all genes with expression data that match your query.
Tips for searching:
- If you are unsure of spelling, begin typing the gene identifier and suggestions will be offered.
- Press the ‘Enter’ key instead of clicking the “Search” button.
- Select the “Show exact matches only” check box to remove the implied wildcards. This is useful if you want to return only those genes that exactly match your search text.
- Place the search text within quotes to include spaces or special characters.
- When searching for more than one gene, separate each search term by a comma.
Boolean Syntax Query
The following special operators can be used to build queries:
- The AND function is implicit, so spaces between words that are not separated by an operator will be treated like AND.
- OR has higher operator precedence than AND.
- Parentheses can be used to group criteria, but nested parentheses are not supported at this time.
Annotation Search
While our automatically-generated semi-quantitative analysis tools (Anatomic Search and Temporal Search) provide an informative global view of gene expression in the developing brain, these tools provide gene expression information primarily about larger brain regions, with limited resolution for precise brain areas. The Annotation Search feature utilizes expert-guided manual annotation performed by Dr. Salvador Martinez of the Neurosciences Institute, Miguel Hernandez University and CSIC in Alicante, Spain.
This feature allows you to search the annotation data for all genes that match specific gene expression criteria. Start by selecting a structure from the developing mouse ontology and then indicate the age(s), the expression intensity(ies), the expression density(ies) and the expression pattern(s). To understand the criteria used to make these manual annotations, please see the Annotation whitepaper in the Documentation tab.
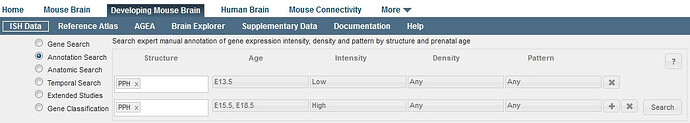
To look for genes that also match additional criteria, click the “+” button to add another row to your search. Remove extra rows by clicking the “x” box. Once you have entered your search criteria, click on the “Search” button. The results are displayed as a list of genes demonstrating gene expression patterns that match your query.
Any genes that meet the criteria in ALL rows of the search will be returned. If two or more specific ages (or intensities, densities or patterns) are selected in a single row, the search will find all results that match any one of the criteria (i.e. an “OR” search).
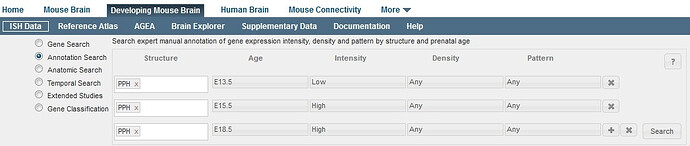
For example, this query displayed above will return many results because the second line specifies that either the E15.5 or E18.5 timepoints can have high expression in the prepontine hindbrain. The query displayed below looks similar but it is much more selective; only a few genes have high expression in PPH for E15.5 AND E18.5, AND Low expression in E13.5.
Viewing Annotation Search Results
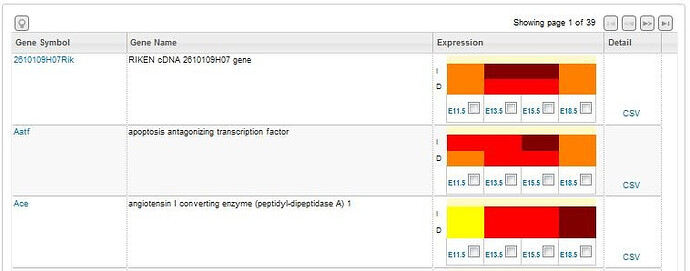
Search returns include a list of experiments that fulfill your search criteria listing the gene symbol, the gene name, an expression summary illustrated in a heatmap format and a link to the .csv annotation document for that gene. The expression summary will include:
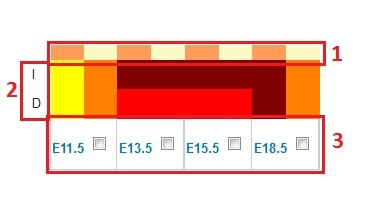
- Structures - The structures you selected colored according to the reference atlas colors as column headers in the heatmap.
- Annotation Results - Row headers are the Intensity (I) and the Density (D) and colored as follows: Grey - Cannot Annotate, Yellow - Undetected, Orange - Low, Red - Medium, Burgundy - High.
- Stages for each experiment - Click on the check boxes to view image series in a separate window.

Anatomic Search

Select the “Anatomic Search” radio button to search for genes that are predominantly enriched within the selected brain structure. Results will be returned for the specified age. Experiments are ranked by the specificity of the gene in the brain structure of interest as opposed to adjacent brain regions. The rank is defined as the ratio of sum of expressing pixel intensities in the numerator set (target region) over the sum of expressing pixel intensities in the denominator set (a defined set of non-overlapping structures, see Data Processing Whitepaper under the Documentation tab). Thirteen structures are generally available for search for each age, with the exception of E11.5, for which five structures are available. The results are provided as a list of experiments for the given age and search query.
Please refer to the Informatics Data Processing white paper in the Documentation tab for additional details.
Temporal Search
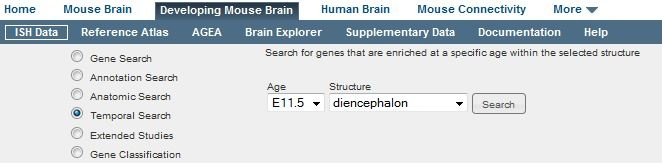
Select the “Temporal Search” radio button to search for genes that are enriched at a specific age within the selected structure. Note that this feature does not search for spatial enrichment; Anatomic Search should be used for that purpose. This search feature compares gene expression in the given structure at the given age and compares it to expression in the same structure at 7 other time points. Results are returned as a list of experiments ranked by their temporal enrichment in descending order, with the most temporally enriched genes first.
Please refer to the Informatics Data Processing white paper in the Documentation tab for additional details.
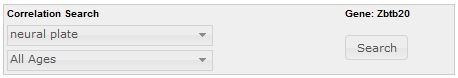
Correlation Search
Once you have found a gene of interest, you can also find genes with a similar expression profile to your gene of interest using the Correlation Search option: once a gene is selected by clicking on the gene name, from the right-hand panel, choose one or more structures from the structure drop-down menu and one or more ages from the ages drop-down menu and then click “Search”. Your search will result in a list of genes with a similar expression pattern to your search criteria.
Extended Studies
A select group of genes were sampled deeper and can be viewed using the Extended Studies radio button.
High Temporal Sampling Study
Select “High Temporal Sampling Study” to see ~20 developmental marker genes characterized by ISH in coronal plane with higher temporal resolution, including 8 embryonic developmental stages and 6 early postnatal stages.
Aging Study
Select “Aging Study” to see ~300 genes surveyed in aged brain at 18 and 24 months.
Viewing Search Results
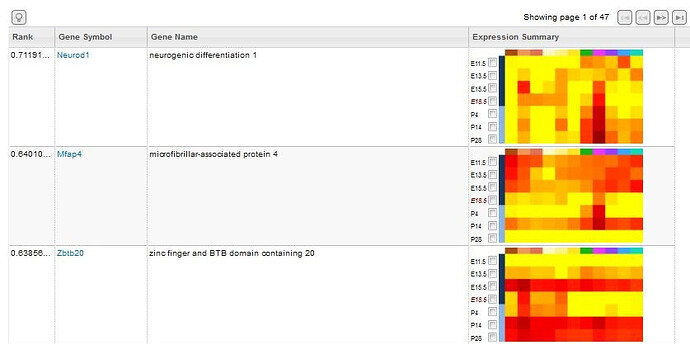
Searches will return a list of genes based on the input search criteria. Each row includes the following information.
Select the experiments to view in greater detail by clicking the checkboxes next to gene and age of interest. Experiments will be saved in your cache until you select the “Clear Selections” button at the bottom of the page. After selecting one or more experiments, click the “View Selections” button.
Once you have selected a gene (by clicking on it’s Gene Name), you can view the rotating 3-D thumbnails in the right hand panel and you can look for genes with a similar expression profile.
Experiment Image Viewer
The experiment image viewer displays images for each selected experiment in a Zoom and Pan viewer. This viewer makes it easy to compare experiments with each other and with the Reference Atlas.
Multiple image series can be opened on the same page to enable side-by-side comparisons. Arrange the experiments by dragging a viewer by the title bar and dropping in a new location. Add one or more reference atlases by selecting from the “Atlases” drop-down menu in the upper-right hand corner of the window.
If you are viewing more than one experiment, open the configuration options to change the number of columns displayed in the window. The configuration options are accessible by clicking on the button with a “gear” icon to the right of the “Atlases” menu.
The gene symbol is displayed in the title bar along with the Allen Institute image series ID. Additional details are displayed across the top of the viewing area, including the image index, tissue index, and tissue location.
Thumbnails for the entire image series are displayed across the bottom of the viewer in section order. Click a thumbnail to select it for viewing, or use the keyboard to navigate through the set. The current selection is outlined in black.
Gene Detail
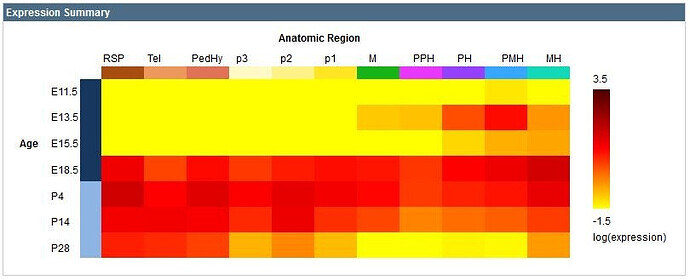
When you click on the gene symbol, you will be taken to a page that describes the experiments involving this gene in detail. The data returned includes gene detail metadata, the Expression Summary and a list of the experiments performed.
Gene detail metadata includes the name of the gene, any aliases this gene may have, the organism that the experiment was conducted on, the Entre ID and the chromosome location of the gene.

The gene expression summary is represented in heatmap format with the age of the mouse on the vertical axis and the anatomic region on the horizontal axis color-coded to the reference atlas. The heatmap illustrates increasing expression energy ranging from a log value of -1.5 in the yellow to 3.5 in the dark red.
A list of experiments conducted on this gene includes:
| Column | Description |
|---|---|
| Click this box to view experiment(s) in the interactive viewing tool | |
| Experimental Detail | Click on this link to be taken to the Experimental Detail page |
| Developmental Stage | Indicates both the developmental age and the Theiler Stage |
| Example Image | Shows a single image from the experiment |
| Rotating Thumbnails | Shows a 3-D image of the gene expression that can be rotated using the slider bar in the column header |
| 3-D File | Links to open up the individual experiment in the Brain Explorer 3-D software. Clicking on the column header will open all the experiments in the Brain Explorer |

Click on one or more experiments to view all the experiments in an interactive environment. This data can also be downloaded as an XML query by clicking on the “This data is also available as XML” link.
Experimental Detail
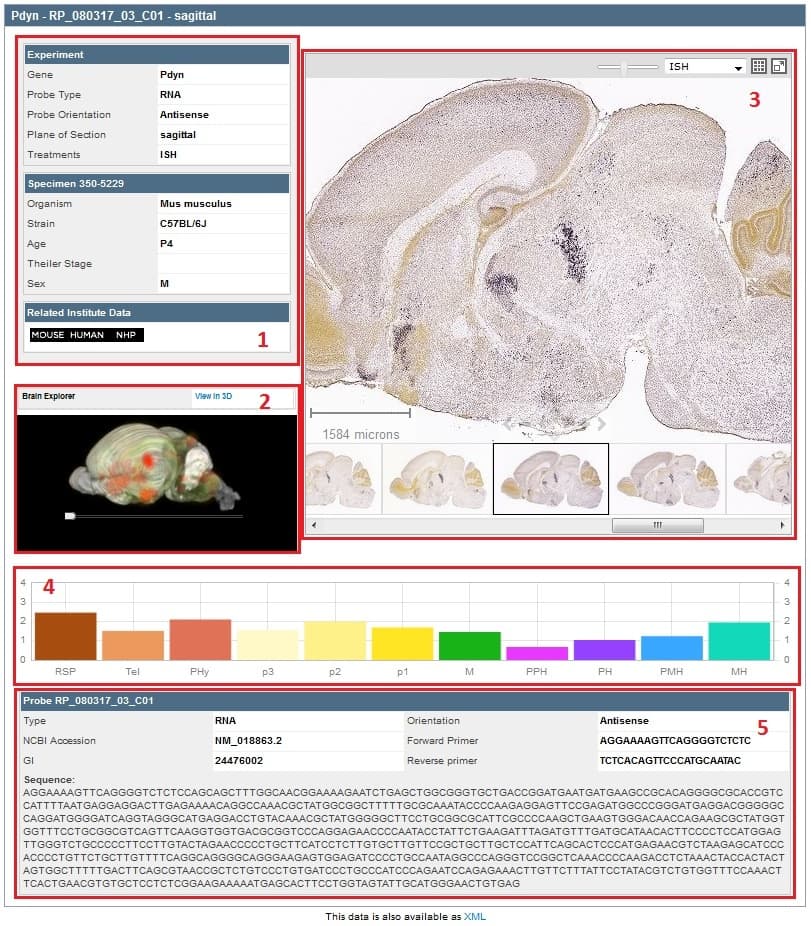
When the experiment is selected by clicking on the experimental ID link, a summary of the experimental detail is returned. The data includes 1) Experiment and Specimen metadata and a link to Related Institute Data 2) an interactive 3-dimensional representation of gene expression, 3) an interactive image viewer that displays the images in the experiment 4) a histogram of the expression energy in 11 different structures, and 5) Probe metadata including forward and reverse primers and probe sequence.
Hovering your mouse over the histogram will sync the image in the single image viewer with the section corresponding to that structure and expression.
Using the Zoom and Pan (ZAP) Image Viewer
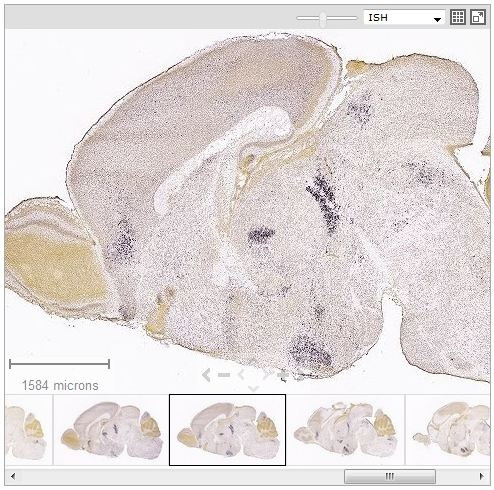
The Zoom and Pan (ZAP) Image Viewer is a powerful tool to navigate and view the images in an experiment. The main part of the viewer is an interactive window where an image can be repositioned by dragging with a mouse. Use the scroll wheel, the on screen navigation tools or the keyboard to zoom in or out.
Select other images in the experiment by clicking on a thumbnail image below the main viewer.
Scale Bar
Drag the scale bar with your mouse to the desired location. Click the text with your mouse to toggle between horizontal and vertical.
Using the ZAP Viewer Toolbar
Use the toolbar to take actions on the image that currently has focus. Toolbar controls include:
| Control | Function |
|---|---|
| Move the slider bar to the left to intensify the contrast or color | |
| Select ISH, Nissl or Expression image type | |
| Display all thumbnail images in a single ‘contact sheet’ | |
| Open the selected image in the image viewer tool | |
| Synchronize all other Zap viewers on the page that support synchronization to the currently selected image | |
| Open a new browser window to review metadata for the image series | |
| Close the Zap viewer |
Keyboard Commands
Use the keyboard to navigate through the image series and synchronize the viewers on the page. Keyboard commands include:
You can also use the arrow keys to pan the current image.
Expression Energy
The expression mask image display highlights those cells that have the highest probability of gene expression using a heat map color scale (from low/blue to high/red).

The Expression Energy was calculated as follows: Within a given area A (voxel or structure), expression energy = (sum of intensity of expressing pixels in A) / (sum of all pixels in A)
Using the High Resolution Image Viewer
The image viewer enables you to view a high resolution image in its own re-sizable window. It is possible to open multiple images by opening multiple windows.
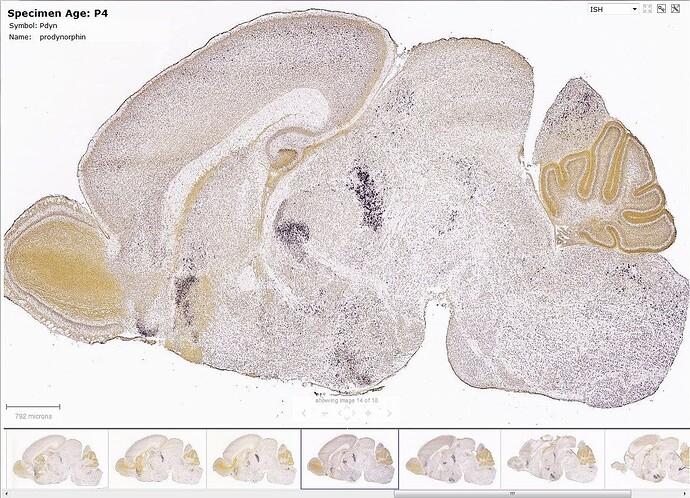
Interacting with the High Resolution Image Viewer is similar to using the ZAP Viewer with some enhanced features accessible from icons in the top right hand of the main image viewer.
| Icon | Description |
|---|---|
| View ISH, Expression Energy, or Reference Stain (Nissl or Feulgen-HP Yellow) | |
| View experiment side by side with the Interactive Atlas Viewer | |
| Allows you to access setting options, including downloading the current image |