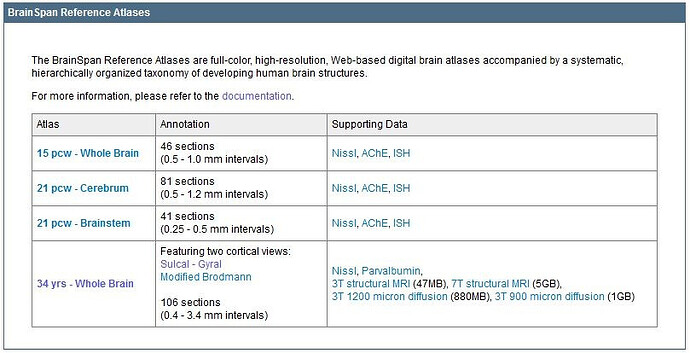
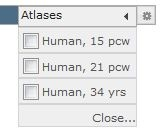
To complement the RNA-Seq and microarray gene expression data, reference atlases were created at three developmental stages; 15 pcw, 21 pcw and 34 years. The reference atlas are full-color, high-resolution, web-based digital brain atlases accompanied by a systematic, hierarchically organized taxonomy of developing brain structures.
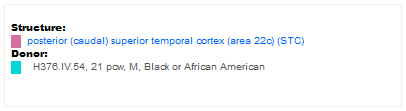
From the heatmap view in the BrainSpan Atlas of the Developing Human Brain, you can see the Structure Ontology list from the selected data point in the heatmap. Clicking on the structure link will bring you to the appropriate developmental stage in the Reference Atlas (adult vs. prenatal).
From the In Situ Hybridization data in the BrainSpan Atlas of the Developing Human Brain, you can also arrive at the Human Brain Atlas Guide by clicking on a hotspot while viewing an experiment in the High Resolution Image Viewer.
Either of these actions will bring you to the Interactive Atlas Viewer with the structure of interest highlighted in purple.
Clicking on the annotation links from the “Reference Atlas” tab in the banner menu will also take you to the Interactive Atlas Viewers. Supporting data used to create these Atlases is also available for viewing or for download.
Learn about Brainspan In Situ Hybridization ISH Data with comprehensive guides and examples from Allen Institute for Brain Science.
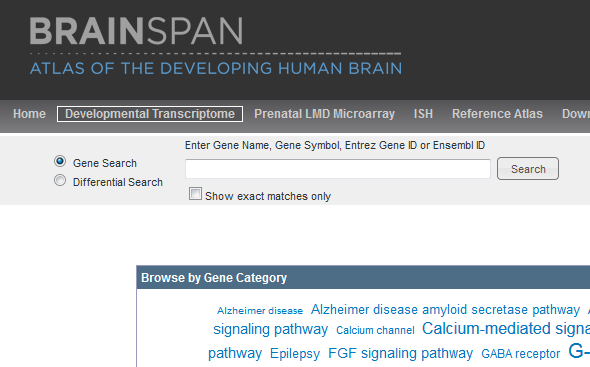
Gene Search
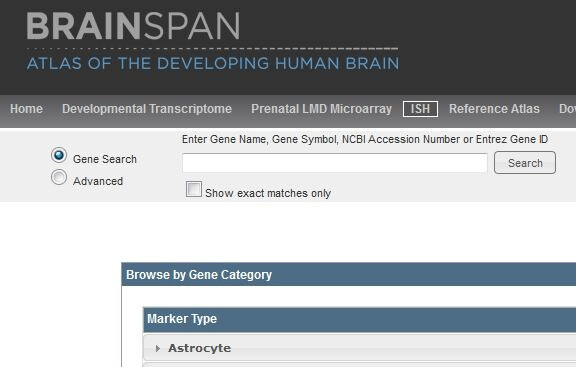
To search for a specific gene or group of genes, type its gene name, gene sympol, NCBI Accession number, or Entrez Gene ID into the search box. Make sure the Gene radio button is selected and click the “Search” button. You will be offered suggestions to choose from while you type, but you can also search by typing the first three or more letters in its name or symbol and appending an asterisk ( * ) as a wildcard. You can also browse through the genes by clicking on a category.
You can sort the search results or further refine your query using the Advanced Search feature.
Advanced Search
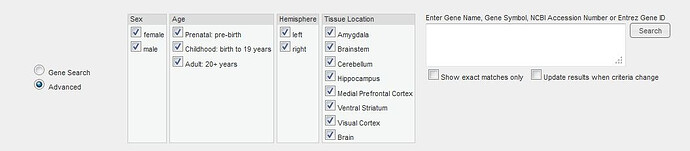
Several additional search criteria can be used to build a query using “Advanced Search.”
The following search criteria can be specified in the text box to the right of the categories. If you copy + paste in a list of terms delimited by tabs or carriage returns they will automatically be converted into a list of search criteria separated by the OR operator ( | ).
Gene symbol
Gene name
Gene aliases
Entrez gene ID
Boolean Syntax
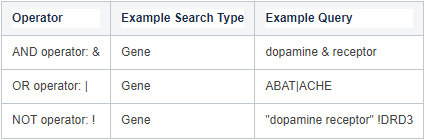
The following special operators can be used to build queries:
AND, OR and NOT may be used in place of their corresponding operators. They must be upper case.
The AND operator (&) is implicit, so spaces between words that are not separated by an operator will be treated like an &.
OR (|) has higher operator precedence than AND (&).
Parenthesis can be used to group criteria, but nested parenthesis are not supported at this time.
The NOT operator (!) is not supported within parenthesis.
Enclose search terms in quotation marks to avoid confusion with boolean operators. For example, hyphenated words should be enclosed in quotation marks (i.e. “ATP-binding”).
Search Results
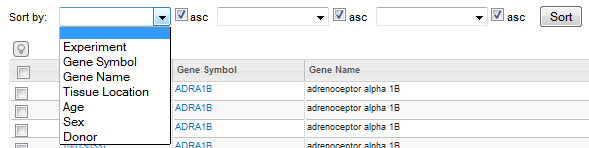
Based on your search criteria, a list of experiments will be returned as described in the table below. Search results can be sorted by up to three categories indicated by the drop down menus. Search categories are prioritized from left to right and include all searchable columns. The checkbox labeled “asc” (ascending order)indicates the sorting direction for each column, so when checked, the sort progresses from a to z , or 1 to n, depending on whether the column is alphabetic or numeric. Leaving the box unchecked sorts the column in descending order, that is z to a, or n to 1.
Column
Description
[checkbox]
Add the image series to your selections by clicking a checkbox. The selected series can be opened in the Zoom and Pan Image Viewer by clicking, “View Selections”
Click the “Related Data” button to display a list of Allen Brain Atlas resources for the species indicated. Please note that the current project is excluded from the list of suggestions. For example, if a “human” link is displayed while viewing human microarray data, it refers to related ISH data.
ISH - Image Viewing
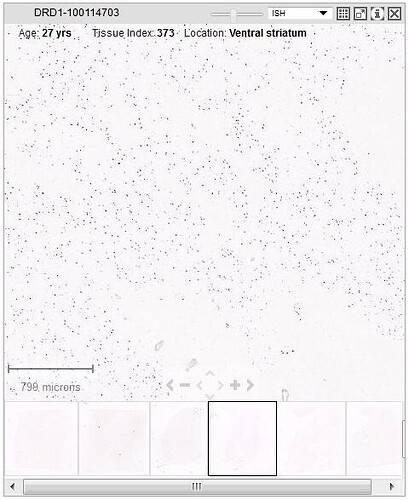
The Zoom and Pan (ZAP) Image Viewer window allows you to view the images from one or more experiments once they have been selected from the search returns list (by clicking the checkbox(es) and clicking “View Selections”). Each ZAP viewer consists of a filmstrip of thumbnails - which when selected will bring up the image in the main viewer, tools to navigate the image in the main viewer and a scale bar to determine the approximate size of the area in the main viewer.
To alter your workspace, click on the selections wheel at the top left hand corner of the ZAP Viewer window to select the number of columns (i.e. the number of experiments you can fit across the page).
The size of your viewers will automatically adjust to fit your screen real estate. Selecting one of the references from the Atlas drop down menu will allow you to see an annotated reference atlas along side your experiments. Drag viewers to other positions to rearrange them.
The gene symbol or treatment type is displayed in the title bar along with the Allen Institute image series ID. Additional details are displayed across the top of the viewing area, including the donor age, tissue index, and tissue location.
Thumbnails for the entire image series are displayed across the bottom of the viewer in section order. Click a thumbnail to select it for viewing, or use the keyboard to navigate through the set. The current selection is outlined in black.
Toolbar
Scale Bar
Shows the current viewing resolution of the image, in microns. This value dynamically changes as you zoom in/out of the image. You can position the scale bar anywhere on the main image by dragging the scale bar by its ruler.
You can toggle the orientation of the scale bar from horizontal to vertical by clicking on the scale bar text. When you download an image, the scale bar is not included with the image.
Side By Side Nissl Viewing
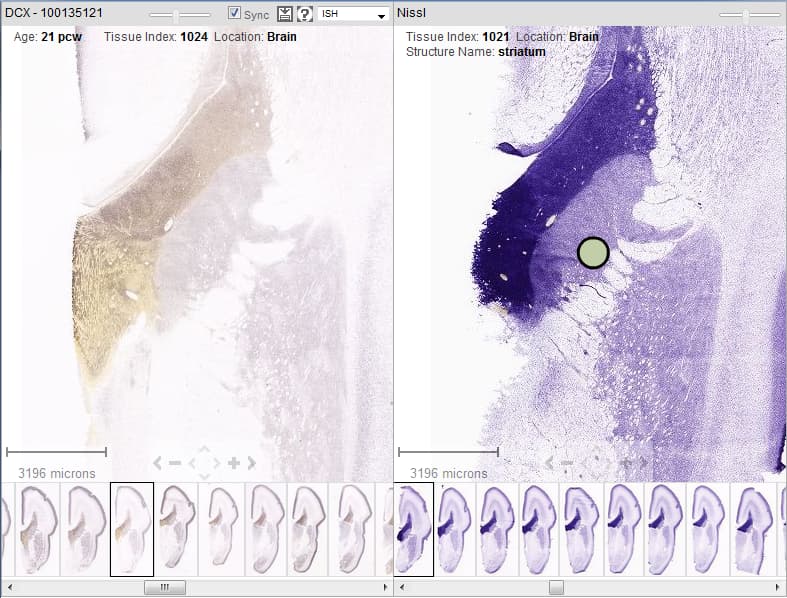
Once you click on the full screen viewer button, you will be taken to a screen with side by side viewers. The left hand viewer shows the ISH image series and the right hand viewer displays the closest Nissl image from the same specimen block. Clicking on another ISH image will automatically display its nearest Nissl section. Clicking on an image thumbnail in the Nissl image series will automatically take you to the nearest ISH image. While the “Sync” box is checked the Zoom and Pan functions will affect both images. Round spots on the Nissl image are “hotspots” and when hovered over will display the name of the structure. Clicking on the hotspots while viewing ISH images from an adult brain will take you to the Adult Human ISH Guide. While viewing pre-natal ISH images, clicking on the hotspot will take you to the appropriate aged prenatal Reference Atlas.
Keyboard Commands
Key
Description
F
Advance to the next image in the series
D
Go back to the previous image
R
Advance to the last image in the series
E
Go back to the first image in the series
A
Zoom in
Z
Zoom out
Expression Mask Colors
The Expression Mask image display highlights those cells that have the highest probability of gene expression using a heat map color scale (from low/blue to high/red).
Experiment Details Page
Clicking on the experiment ID from the search results page will return a page with metadata about the experiment including experiment details, specimen details, related Institute data, probe details and a ZAP Image Viewer.
Gene Details Page
When you click on the the gene symbol from the search returns page you will be taken to a page that includes all the experiments performed in this study with this gene.
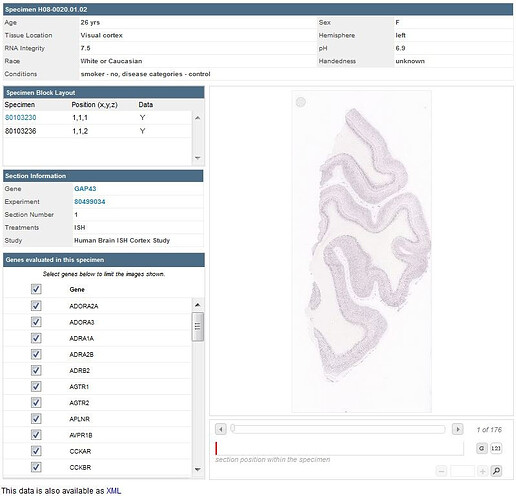
Specimen ID - internal ID Age - years Sex - male or female Tissue Location - tissue origination in brain Hemisphere - right or left hemisphere tissue origination RNA Integrity Number - metric indicating RNA integrity from tissue. Ranges from 1 to 10 (degraded to intact RNA) pH - tissue sample pH Race - ethnicity Handedness - right, left, or ambidextrous Conditions - disease conditions, smoker
Specimen Block Layout
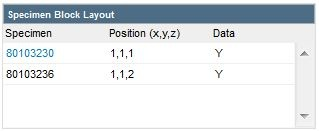
Specimens are received as variable sized blocks of frozen tissue. Before they are sectioned for ISH experiments they are divided into a number of sub-specimens. Throughout this site, when we refer to a specimen we are actually referring to one of these sub-specimens.
This list denotes the current sub-specimen (in black) and sibling sub-specimens, with their locations and whether data was collected on the sub-specimen. Sibling sub-specimen can be viewed if there is data (denoted by Y) by clicking on their links.
Section Information
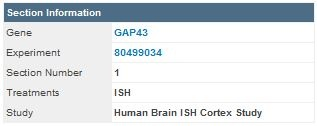
The section information box lists information from the current gene pictured in the image viewer including the gene name, the experiment ID, the section number, the treatment and which study the data came from.
Gene Information
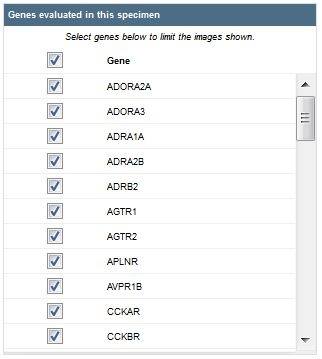
The Gene information section lists the genes that were assayed in this specimen block
By default, all genes from this specimen are selected for viewing. You can select fewer genes/histological stains to view in the image viewer by first clicking the “Gene” checkbox, then selecting the checkboxes next to the gene/stain(s) you would like to view.
Image Viewer
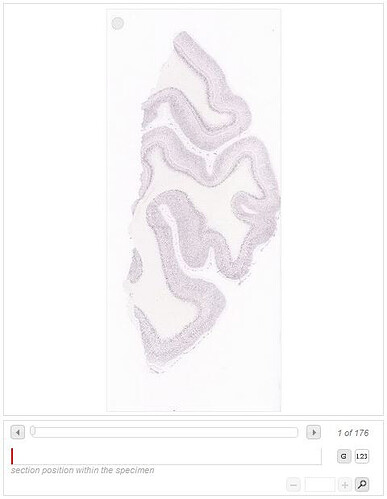
The viewer displays the image from the current gene listed in the section information box. Below the image is an indicator of the position in the specimen block of that particular section, as well as a visualization of the depth of the section into the block. You can view the sections in order (default or by clicking the 123 button (see below)) or grouped by gene (see below)
123 Button
Gene Button
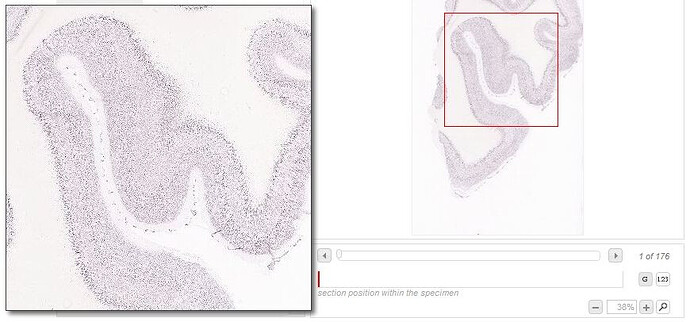
When you click on the magnifying glass in the bottom of the image viewer, a new window will open with a magnified view the area in the image viewer outlined by the red box. you can increase or decrease the magnification with the scale at the bottom.
Brainspan Searching The Developmental Transcriptome
Learn about Brainspan Searching The Developmental Transcriptome with comprehensive guides and examples from Allen Institute for Brain Science.
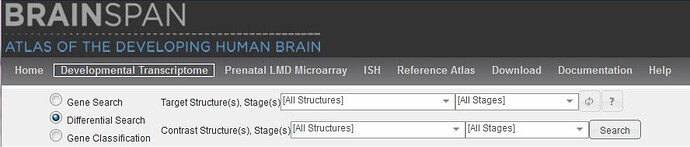
The Developmental Transcriptome search functionality can be found by clicking the corresponding button in the menu bar.
Three search types are available: (1) Gene Search, to obtain gene expression data for specific genes of interest, (2) Differential Search, to compare expression between two sets of brain structures at desired developmental stages, and (3) Correlative Search, to find genes that have an expression pattern similar to a “seed gene” selected from the results of a Gene or a Differential search.
Clicking on the “?” button from any search type will take you to the appropriate help section.
Gene Search
With the Gene Search radio button selected (default) you can either select a category from the tag cloud or type the name of your gene of interest into the text box and then click Search. With the October 2013 release, sequence data from non-coding regions was also added to the data-base. You can find that data by entering the ncRNA Ensembl ID.
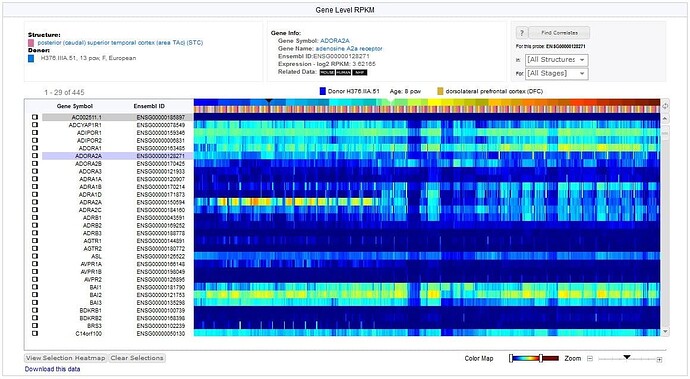
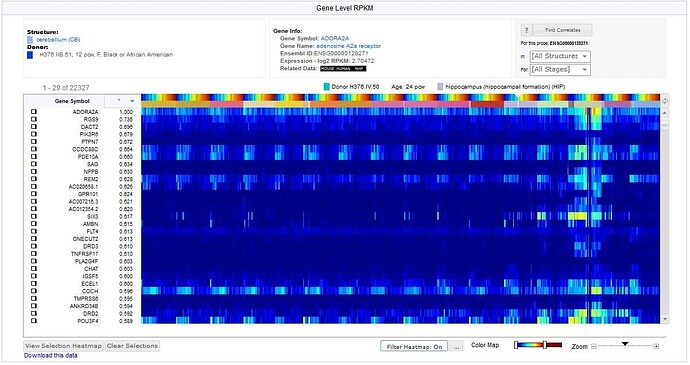
Results will be returned in a heat map format with the genes on the y-axis (vertical) and the donors/structures on the x-axis (horizontal). The heat map represents the normalized gene level RNA-Seq expression data in RPKM (Reads Per Kilobase of exon model per Million mapped reads). By default, the columns in the heat map are sorted first by donor, then by structure. To toggle the initial sort parameter, click the toggle button in the top right hand corner of the heat map.
Clicking on a data point in the heat map will bring up more information in the panel above the heat map. This information includes the structure (click to be taken to the reference atlas) and donor information, gene information including gene name and symbol (Click to be taken to the exon level data), Ensembl ID, gene expression (in log2 RPKM) and a link to related data in other Allen Brain Atlas resources.
You can adjust the window and the level of the color scale on the heat map by adjusting the threshold bars or re-centering the color map scale bar. You can also zoom in or out to see the heat map at different magnification levels.
You can select a set of probes for later use by selecting the check-boxes beside the list of gene symbols. Your choices are stored in a browser cookie in your computer and will remain in effect until you click the “Clear Selections” button or clear your web browser’s cookie cache. Click the “View Selections” button to see your selections.
Differential Search
Another common usage of gene expression databases is to find genes that show enrichment of expression in one set of samples compared to another set of samples. This type of query is supported by the “Differential Search” mode. Select the “Differential Search” radio button. To find genes enriched in one “target set” of brain regions and/or developmental stages compared to a “contrast set” of brain regions and/or stages, choose the target set using the “Target Structure(s)/Stage(s)” drop down menu, and the contrast set using the “Contrast Structure(s)/Stages(s)” drop down menu. The default setting selects all structures and stages, but clicking on the “All Structures” or “All Stages” drop down menu will allow you to select individual structure(s)/stages(s). Then click “Search”.
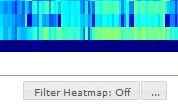
The search will return a list of genes enriched in the target domain over the contrast domain. To see only the domains selected from your search criteria, select the “Filter Heatmap” button below the heatmap.
Once selected a window will open allowing you to select the structures and the developmental stages you are interested in visualizing.
Once you have identified a single gene and want to dig deeper into the exon level expression data, click on the blue colored gene name or symbol above the heat map. This link takes you to the transcriptome visualization page.
Correlative Search
In using gene expression databases, a “search by example” feature is also highly desirable as genes with similar expression patterns may be related in function. Using the “Find Correlates” search utility will accomplish this function. This search by example facility is also available in the Allen Human Brain Atlas as well as in the Allen Mouse Brain Atlas and in the Allen Developing Mouse Brain Atlas.
Once you have selected a gene of interest (by clicking on the heat map that results from a Gene or Differential search), you can find genes with similar expression patterns over the entire dataset or over a subset of structures and developmental stages. These subsets can be chosen using the drop down menus. All structures are checked by default, but clicking “All Structures” a second time will deselect all structures, similarly for “All Stages”. Once you have selected the brain region(s) and development stage(s) of interest, click “Find Correlates”.
The search will return a list of genes enriched in the target domain over the contrast domain. To see only the domains selected from your search criteria, select the “Filter Heatmap” button below the heatmap.
Once selected a window will open allowing you to select the structures and the developmental stages you are interested in visualizing.
Once you have identified a single gene and want to dig deeper into the exon level expression data, click on the blue colored gene name or symbol above the heat map. This link takes you to the transcriptome visualization page.
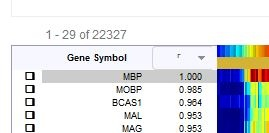
You can see “anti-correlated” genes by toggling the sort order on column “r” or scrolling to the bottom of the heat map.
Download Search Results
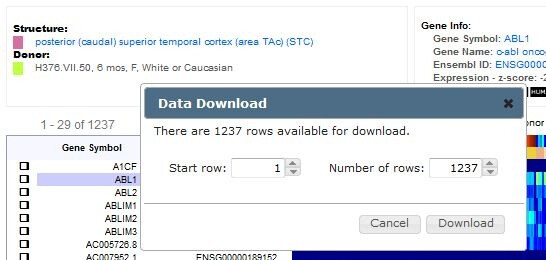
To download your search results, click the “Download this data” link at the bottom left of the heatmap. You will have the option of downloading up to 2000 genes at a time starting from any position in the heatmap. Your start position can be determined from the counter in the top left corner of the heatmap (see screenshot).
Your data will be downloaded as three separate files: 1) a Columns.csv file that lists the column headers with associated metadata for each sample, 2) a Rows.csv file that lists the row headers with associated metadata for each gene, and 3) an Expression.csv file that provides a matrix of the expression values for each data point.
The column headers, row headers and expression data will be consistent with the settings from which you downloaded the heatmap (i.e. color map).
Data Visualization
The transcriptome visualization page is divided into 3 sections.
The first section contains gene Information data including the Ensembl symbol and ID, the chromosome number, the NCBI Entrez symbol, ID and name, gene aliases, links to the USC and the Ensembl genome browsers which take you directly to gene locus data, and links to related data from other Allen Brain Atlas resources.
The second section provides a composite gene model where exons are represented by boxes and introns are represented by the green lines between exons. When you hover your mouse over an exon in either the RNA-Seq or exon array data, the exon is highlighted in this model.
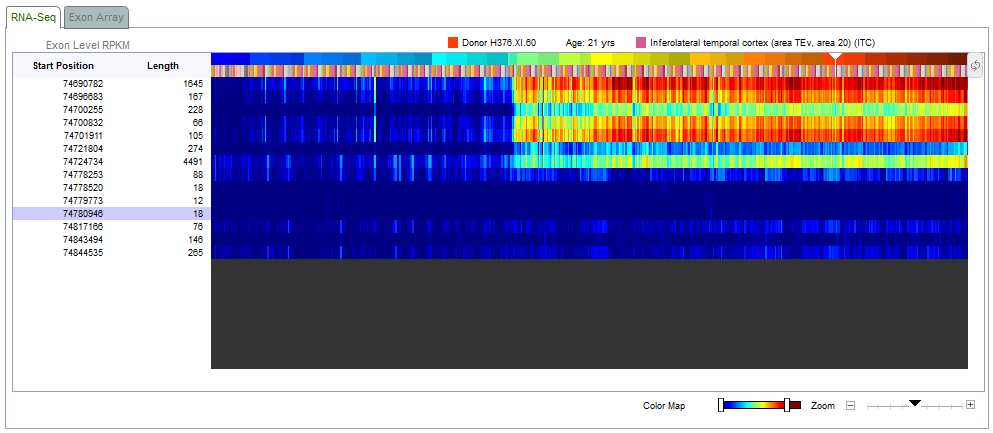
The third section contains two tabs: A tab labeled RNA-Seq with a heat map of the exon level expression data in RPKM (Reads Per Kilobase of exon model per Million mapped reads). A second tab labeled Exon Array with a heat map of the exon probeset level expression data in log2 transformed normalized expression intensity values.
This data can be downloaded by clicking on the “Download this data” link at the bottom left of the heatmap.
Transcriptome Heat Maps
The heat map is a visualization of the exon expression values for the returned gene of interest. The heat map data is presented as a matrix with brain structure (by developmental stage) on the x-axis and gene exons on the y-axis. Brain structures are organized in ontological order. Clicking on the toggle button in the right hand corner will toggle the initial sorting parameter from structure to developmental stage.
Each row of the heat map in the RNA-Seq data represents an exon. Exons in the RNA-Seq data are labeled by the start position on the chromosome and the length of the exon. Each row of the heat map in the Exon Array data represents an exon probeset. Approximately 4 probes are selected for each putative exon region and called a probeset. Each row in the Exon Array data is labeled with the chromosome start position and the length of the probeset. Hovering the mouse over the exon in either heat map will highlight the corresponding exon in the composite gene model over the array data.
Each column of the heat map represents a tissue sample. The colors of the heat map are expression values, transformed to a log 2 scale. The color scale ranges from dark blue representing low expression and passes through cyan, yellow, orange and finally to dark red representing high expression. Hovering the mouse over a cell of the heat map will bring up donor and structure information in the area above the heat map.
Download XML or CSV containing tissue sample meta-information and URL to download each of the raw LMD microarray files.
3-D Fiber Tract and Developmental Transcriptome Sampling Annotation
3-D expert annotation of 22 major fiber tracts across 8 developmental stages accompanied by annotation of the Developmental Transcriptome survey sampling sites.