This document provides a brief overview of the data, database organization and example queries. API database object names are in camel case. See the main API Documentation for more information on data models and query syntax.
The accompanying Allen Software Development Kit (SDK) provides python code for accessing electrophysiology data (NWB files) for all cells and morphological reconstructions (SWC files) for a subset of cells. The Allen SDK also provides sample code demonstrating how to download neuronal model parameters and run your own simulations using stimuli for the experiments or custom current injections.
Experimental Overview And Metadata
All data used in the web application is available in the ApiCellTypesSpecimenDetail table. Data includes structure, cortical layer, dendrite type (spiny, aspiny, sparsely spiny, n/a), apical dendrite status (intact, truncated, n/a), and others. Mouse-specific records include the transgenic line name and reporter status. Mouse-specific records include disease condition (epilepsy, tumor, none) and years of seizure history.
See whitepapers for detailed experimental and annotation information.
From the API, detailed information about cells can be obtained using RMA queries.
All cells in the Allen Cell Types Database have electrophysiological recordings of responses to stimuli from a common set of current injection protocols. See the electrophysiology overview whitepaperfor details on specimen selection, tissue processing, recording, and quality control.
The Cell Types Database categorizes detailed stimulus protocols into set of high level descriptions:
Stimulus Group Name
Description
Short Square
3 ms square pulse injections from 100 pA to action potential generation, then 10 pA increments to further probe action potential threshold.
Short Square - Hold -60mV
Short Square, holding rest at -60mV
Short Square - Hold -70mV
Short Square, holding rest at -70mV
Short Square - Hold -80mV
Short Square, holding rest at -80mV
Short Square - Triple
3 x 3 ms square current injections at threshold amplitude. Interpulse intervals (start to start) are 7, 11, 15, 19, 23, 27, 31, and 35 ms.
Long Square
1 s square current injections from -110 pA (or -190 pA for some Pvalb neurons) to rheobase + 160 pA, in 20 pA increments. For a subset of cells, rheobase is further probed to within 10 pA.
Square - 2s Suprathreshold
2 s square current injections to rheobase + 40 pA and 80 pA. Each amplitude is repeated 3-4 times.
Square - 0.5ms Subthreshold
0.5 ms square current injections to +/- 200 pA, repeated 20 times (200 ms intervals).
Ramp
A ramp current injection with a slope of 25 pA/s is delivered, then terminated after the neuron fires a short series of action potentials.
Ramp to Rheobase
1 s pink noise epochs created using two different random seeds riding on top of a ramp transitioning to a plateau. The ramp portion of the stimulus is 14 seconds long. The noise on the ramp consists of alternating seeds all with a CV of .01. The noise on the plateau are organized into periods of six seconds containing noise of three different CV’s with increasing and decreasing CV at 0.2, 0.4, 0.6, 0.4, and 0.2. After a period is completed using one random seed, the other random seed is played for a total of three periods.
Noise 1
Pink noise with a coefficient of variation (CV) equal to 0.2 is used to as it resembles in vivo data. These stimuli consist of 3 x 3 s noise epochs riding on top of square pulses at 0.75, 1, and 1.5 times rheobase. Recovery intervals between stimuli are 5 s.
Noise 2
Noise 1, with a different random seed
Test
General protocols used for testing experiment status
Stimulus sweeps that pass quality control standards are available for download as Neurodata Without Borders (NWB) files. To find the NWB download link for Rorb cell specimen 320654829, use this query:
The Allen SDK provides a simple Python module to support downloading metadata and NWB files for cells in the Cell Types Database. Please see the Data API Client documentation page to see an example.
A standard set of electrophysiological features are automatically computed from the recorded responses of each cell. A subset of those features are displayed at the top of the electrophysiology page for a cell:
Feature
Description
Upstroke:downstroke ratio
The average ratio between the absolute values of the action potential peak upstroke (i.e. max dV/dt) and the action potential peak downstroke (i.e. min dV/dt) for “Short Square” pulses.
Fast AP trough
Minimum value of the membrane potential in the interval lasting 5 ms after the peak of the first action potential for the minimum amplitude “Long Square” stimulus that elicited an action potential.
FI curve slope
Slope of the frequency response (in spikes/sec) vs. stimulus intensity (in pA) curve based on a linear regression for all suprathreshold “Long Square” sweeps.
Rheobase
Minimum stimulus amplitude eliciting an action potential from “Long Square” sweeps.
Ramp AP Time
Average time of the peak of the first action potential for “Ramp” sweeps.
Resting Vm
Average resting potential across all “Long Square” sweeps.
See the electrophysiology overview whitepaper for a complete list of computed features and their interpretations.
Use this query to download the features computed for Scnn1a cell specimen 467703703:
Morphology
The Allen Cell Types Database contains morphological reconstructions generated from bright-field images of biocytin-stained cells. Reconstructions are generated by manually curating the results of an automated segmentation algorithm. See the morphology technical whitepaper for more details.
A standard set of morphological features were computed for all reconstructed cells. A subset of those features are displayed at the top of the cell-specific morphology page:
Feature Name
Description
Max Euclidean Distance
The maximum Euclidean distance of all nodes. Euclidean distance is the straight line distance from the soma (root) to the node.
Number of Stems
The number of stems attached to the soma. When the type of the node is not soma, it is labeled as a stem.
Number of Bifurcations
The number of bifurcations for the given input neuron. A bifurcation point has two daughters.
Average Contraction
The average ratio between Euclidean distance of a branch and its path length. Euclidean distance of a branch is the straight-line distance from the soma to the branch. Path length is the sum of the lengths between each node along the path.
Parent:Daughter
The average ratio between the diameter of a daughter branch and its parent branch. One value for each daughter branch is generated at each bifurcation point.
See the morphology technical morphology technical whitepaper for a complete list of computed morphological features.
The API provides programmatic access to the microscopy images used for reconstruction, axis-oriented projections of those images, and morphological reconstructions. A cell can have up to four axis-oriented projections of the images used for reconstruction:
XY minimum intensity projection
YZ minimum intensity projection
XY maximum intensity projection
YZ maximum intensity projection
The reconstruction images display a dark, biocytin-filled cell on a light background. The maximum intensity projections are constructed from inverted and contrast-enhanced versions of the morphology images, resulting in a light cell on a dark background.
The Allen Cell Types Database contains two types of neuronal models: perisomatic biophysical models and generalized leaky integrate-and-fire (GLIF) models. These models attempt to mathematically reproduce a cell’s recorded response to a current injection. The perisomatic biophysical models take into account dendritic morphological structure, whereas GLIF models are simple point neuron models which represent the neuron as a single compartment.
There are five levels of GLIF models with increasing levels of complexity. The most basic model is a simple leaky integrate-and-fire equation. More advanced GLIFs attempt to model variable spike threshold, afterspike currents, and threshold adaptation.
Model Name
Description
1 Leaky Integrate and Fire (LIF)
Standard circuit representation of a resistor and capacitor in parallel with a leaky membrane.
2 LIF + Reset Rules (LIF-R)
LIF with biologically-derived threshold and voltage reset rules in addition to a biologically derived threshold decay.
3 LIF + Afterspike Currents (LIF-ASC)
LIF with spike-induced currents to model long-term effects of voltage-activated ion channels.
4 LIF-R + Afterspike Currents (LIF-R-ASC)
LIF with additional Reset Rules and Afterspike Currents.
5 LIF-R-ASC + Threshold Adaptation (LIF-R-ASC-A)
All of the above, with an additional voltage-dependent component of threshold.
Biophysical, perisomatic
Models with active conductances at the soma and passive dendritic morphology based on full 3D reconstruction.
Biophysical, all-active
Models with active conductances at the soma and along the dendritic morphology based on full 3D reconstruction.
See the perisomatic biophysical and GLIF technical whitepapers for more details on how these models were created.
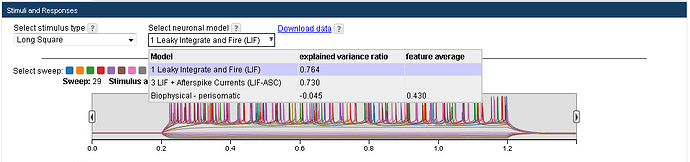
A cell’s electrophysiology page displays all available models. Choose a model to see its simulated response to all stimuli presented to the cell. If the required sweeps are available, two model evaluation metrics are computed per model:
Metric Name
Required Sweeps
Description
Explained Variance Ratio
Noise 2 (at least two)
For “Noise 2” sweeps, the ratio of the mean explained variance of model spike times vs. experimental spike times to experiment-only mean explained variance.
Feature Average
Sweeps used for biophysical model fitting
Average absolute z-score comparing average spike features computed on model responses for sweeps used for fitting to spike features computed on experimental responses.
After selecting a model for display, the models ID number and a link for downloading necessary to run the model are available. For example, the link to download model 566296565 (a LIF model for Scnn1a cell 467703703) looks like this:
All models in the Allen Cell Types Database are available for download and local execution via the Allen Software Development Kit (SDK). The biophysical models require NEURON to be run, which the SDK helps to configure. The GLIF simulation module comes as part of the Allen SDK. Please visit the Allen SDK page for more details.
Examples:
Find all cells with perisomatic biophysical models
Learn about Cell Types Database Transcriptomics with comprehensive guides and examples from Allen Institute for Brain Science.
Single cell transcriptomic profiling
You can download processed RNA sequencing data for mouse cells and human nuclei from the RNA Seq page. You can also download from that page the reference genomes (.gtf files) used to align the raw data. For information on the methods used to obtain the data see the whitepapers located in Documentation.
The sampled brain regions and the number of samples are listed below. The data for each brain region is provided in a zip file containing the numerical data in matrix form, and separate csv files with information on the individual samples (columns) and genes (rows) in the reference genome used. Details are provided in a README.txt file.
Learn about Cell Types Database Physiology And Morphology with comprehensive guides and examples from Allen Institute for Brain Science.
Searching the database
In the current release of the Allen Cell Types Database, we include electrophysiological recordings from 1058 mouse cells and 279 human cells. For a subset of these cells, we also include morphology reconstructions and neuronal models. The Cell Feature Search page allows you to select cells that satisfy certain conditions and to view summary cards for those cells in a desired sorting order. From a cell’s summary card, you can then navigate to pages that contain detailed electrophysiology or morphology information for that cell.
The Cell Feature Search page is divided into three areas: 1) In the top area, you can set filters for cell properties that have discrete values; for example, you can choose to select only cells from a certain species and certain cortical layers. You can also use this page to find cells for which specific types of data are available; for example, you can select only cells for which there is not only electrophysiology data, but also morphology reconstructions and neuronal models. 2) In the middle area, you can set conditions on numerical features in certain value ranges by using a parallel coordinate plot. 3) In the bottom area, you can view the summary cards for the cells selected with the filters set in the two areas above and then choose the sorting order in which those cards are displayed.
Filters
You can set filters for cell properties or data types by checking boxes and selecting one or more items from the drop-down menus at the top of the Cell Feature Search page. (Note: the Transgenic Targeting section applies only to mouse cells, while the Donor Profile selection applies only to human cells.)
The following table describes the meaning of the properties available for filtering. For more details on the properties, see the Documentation.
Property name
Property description
Species
Species of recorded cell.
Area
Brain region of recorded cell.
Layer
Cortical layer of recorded cell.
Hemisphere
Hemisphere of recorded cell.
Mouse line
Transgenic driver of reporter expression.
Reporter status
Expression of transgenic reporter.
Age
Age of human donor.
Years of seizure
Length of seizure history.
Donor
Human donor id.
Sex
Sex of human donor.
Disease
Disease state of human donor.
Ethnicity/Race
Ethnicity/race of human donor.
Reconstruction type
Extent of morphology reconstruction.
Dendrite type
Status of dendritic spines.
Apical dendrite status
Extent of apical dendrite preservation, if applicable.
Has GLIF model
Existence of GLIF model for cell.
Has all-active biophysical model
Existence of all-active biophysical model for cell.
Has perisomatic biophysical model
Existence of perisomatic biophysical model for cell.
Parallel coordinate plot of cell features
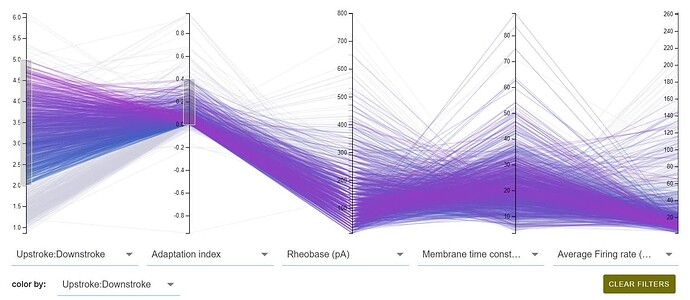
You can use the parallel coordinate plot to select cells whose numerical features satisfy certain conditions. First you choose up to five different fetures from the drop-down menus under the axes, and then you select the value ranges of interest by clicking on the axes. For example, the cells selected in the figure below have Upstroke:Downstroke ratios in the range 2.0 to 5.0 and Adaptation indeces in the range 0.0 to 0.4. Each line represents a cell and the intersection with each axis indicates the value of the feature associated with that axis. Cells that do not have feature values in the selected ranges are represented by gray lines.
The “color by” drop-down menu allows you to select the feature whose values determine the line color for the cells. For example, in the figure below the lines are colored according to the Upstroke:Downstroke ratio values, so cells with higher values are represented by purple lines while cells with lower values are represented by blue lines.
The following table describes the meaning of the properties available in the drop-down manus.For more details on the properties, see the Documentation.
Property name
Property description
Electrophysiology
Adaptation index
Rate at which firing speeds up or slows down during a stimulus.
Average firing rate (spikes/s)
Average firing rate across the entire stimulus interval.
Average ISI (ms)
Average interspike interval duration.
F-I curve slope (spikes/s/pA)
Slope of linear fit to the frequency response of the cell versus stimulus intensity curve.
Input resistance (MΩ)
Resistance of cell membrane as measured by a linear fit to responses to hyperpolarizing current steps.
Membrane time constant (ms)
Time constant of exponential fit to responses to hyperpolarizing current steps.
Ramp spike time (s)
Time to first spike evoked by a slow current ramp.
Resting potential (mV)
Average of the pre-stimulus membrane potential.
Rheobase 
Minimum current amplitude of one-second-long steps that evoked an action potential.
Upstroke:Downstroke
Ratio between the peak upstroke (rate of rise of the action potential) to peak downstroke (rate of fall of the action potential).
Morphology
Average contraction
Average ratio between Euclidean distance of a branch and its path length.
Maximum euclidean distance (μm)
Maximum Euclidean distance from the soma to all nodes.
Normalized cortical depth
Depth of the cell soma normalized between pia (0) and white matter (1).
Bifurcations
Number of points where a process splits into two daughter processes.
Soma stems
Number of processes attached to the soma.
Parent:Daughter
Average ratio between the diameter of a daughter branch and its parent branch.
Cell summary cards
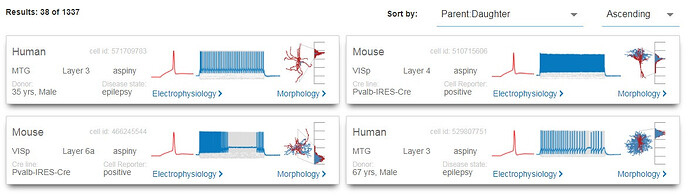
The cell summary cards display the results of the selections specified by the filters and the parallel coordinate plot. You can sort the cards according to any cell feature by using the drop-down menus on the top right. For example, the figure below shows cards sorted in ascending value of the Parent:Daughter cell feature.
Each card provides a short summary of cell properties as well as links to pages with detailed information on the electrophysiology data and, when available, the morphology data.
The cards display the following information. For more details on the properties, see the Documentation.
Property name
Property description
Species
Species of recorded cell.
Cell id
Unique cell identifier.
Area
Brain region of recorded cell.
Layer
Cortical layer of recorded cell.
Dendrite type
Status of dendritic spines.
Cre line
Transgenic driver of reporter expression (mouse cells only).
Cell reporter
Expression of transgenic reporter (mouse cells only).
Donor
Age and sex of donor (human cells only).
Disease state
Disease state of donor (human cells only).
Short pulse thumbnail (red)
Single action potential elicited by a short (3 ms) square current injection.
Long pulse thumbnail (blue)
Subthreshold, threshold, and suprathreshold responses to a sustained (1 s) square current injection.
Electrophysiology link
Link to page displaying the electrophysiology experiment results and, when they are available, neuronal model simulations.
Morphology thumbnail
The 2D projection of the neuron reconstruction shows dendrites in red, apical dendrite in orange and axon in blue.
The scale on the right represents the normalized cortical depth, from white matter to pia. The histogram shows the density of neuronal processes as a function of depth.| |Morphology link|Like to page displaying morphology properties of the cell when they are available.|
Electrophysiology details page
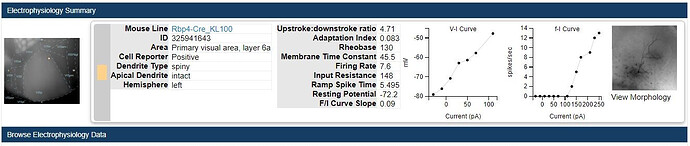
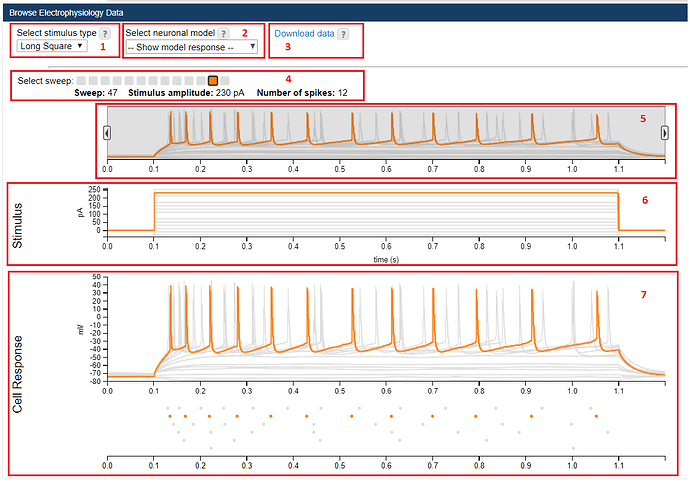
The electrophysiology details page gives you access to the available electrophysiology information for a given cell. The top section of the page provides a summary of the cell properties, while the second allows you view the traces recorded for different stimulus types. For details on the experimental methods, see the Documentation.
The following discussion explains how to use the different menus and controls on the page to view and download the electrophysiology data. If neuronal models are available for that cell, you can choose to view the simulated data on the page and also download the model parameters. See also the Data access and download section.
Select Stimulus type: A drop-down menu from which you can select the stimulus type and see the resulting Cell Response.
Select Neuronal Model: When available, neuronal models have been run on the data and when selected will open below the recorded Cell Response.
Select Sweep: Select sweeps will be available for you to inspect from this view. As you hover your mouse over each colored square, not only do you see the resulting graphs change to reflect the sweep selected, but you also will see sweep metadata (Sweep #, Stimulus amplitide ¶ and # of spikes) listed below the squares. Once you click on a colored square, you can use left/right arrow keys to move between the sweeps.
Slider Bar: This feature allows you to zoom in and out of the Stimulus, Cell Response and Model views by clicking and dragging on the arrows.
Stimulus: The stimulus injected into the cell.
Cell Response: The response of the cell to the injected stimulus.
Stimulus Types
Different sets of stimulation waveforms were used in order to:
Interrogate intrinsic membrane mechanisms that underlie the input/output function of neurons a. Linear and non-linear subthreshold properties b. Action potential initiation and propagation c. Afterhyperpolarization/afterdepolarization
Understand aspects of neural response properties in vivo a. Stimulation frequency dependence (theta vs. gamma) of spike initiation mechanisms b. Ion channel states due to different resting potentials in vivo
Construct and test computational models of varying complexity emulating the neural response to stereotyped stimuli a. Generalized leaky-integrate-and-fire (GLIF) models b. Biophysically and morphologically realistic conductance-based compartmental models
Morphology details page
The morphology details page gives you access to the available morphology information for a given cell. The top section of the page provides a summary of the cell properties, while the second displays two orthogonal projections of the biocytin filled neuron and the neuron’s 3D morphology reconstruction. From this page, you can also view the stack of high resolution images used for the reconstruction. For details on the imaging and neuron reconstruction methods, see the Documentation.
The following discussion explains how to use the different menus and controls on the page to view and download the morphology data. See also the Data access and download section.
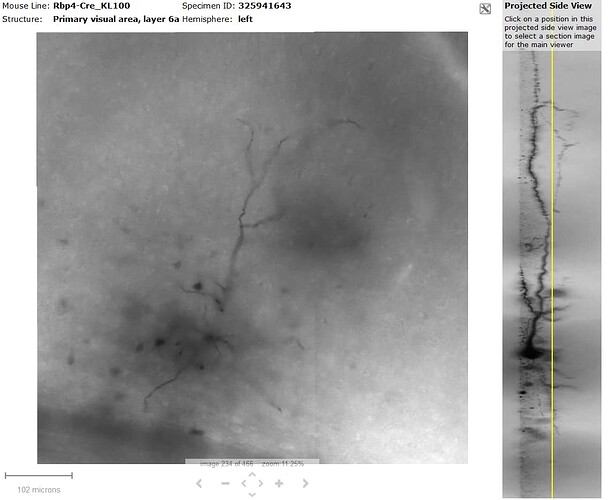
From the Projected top view, you can zoom into the picture from the on-screen navigation tools, the Keyboard Commands or using your scroll wheel. The two views of the neuron are synched so zooming in on one will also zoom the other. Clicking on “View image stack” will take you to an image viewer to view the individual images taken of this neuron.
The image viewer of the 3D neuron reconstruction allows for visualization of the reconstructed neuron using the onscreen navigation tools. Clicking “Reset” will reset the neuron to its default view. The legend in the 3D reconstruction indicates the various components of the reconstruction.
You can download both the reconstruction (as an .swc file) or the calculated morphology measurements (as an XML) from the links below the viewers.
Morphology Image Stack
Clicking “View Image Stack” while browsing the Morphology data will take you to our image viewer. The title bar includes the Mouse Line, the Specimen ID, the structure and the hemisphere. The “Configure” icon opens a menu that will allow you to vary the image contrast and download the individual images. The entire image stack can be navigated through using the on screen navigation tools, using the Keyboard Commands or by clicking on the Projected Side View.
Scale Bar
Shows the current viewing resolution of the image, in microns. This value dynamically changes as you zoom in/out of the image. You can position the scale bar anywhere on the main image by dragging the scale bar by its ruler.
You can toggle the orientation of the scale bar from horizontal to vertical by clicking on the scale bar text.
Keyboard Commands
Key
Description
F
Advance to the next image from the specimen
D
Go back to the previous image from the specimen
A
Zoom in
Z
Zoom out
Neuronal models
Reprocessing of the data occurred for the March 2016 release so any analysis performed prior to the March 2016 release date should be performed again with the new models.
The Allen Cell Types Database contains three types of neuronal models: two biophysical models and generalized leaky integrate-and-fire (GLIF) models. These models attempt to mathematically reproduce a cell’s recorded response to a current injection. The biophysical models take into account dendritic morphological structure, whereas GLIF models are simple point neuron models that represent the neuron as a single compartment.
There are five levels of GLIF models with increasing levels of complexity. The most basic model is a simple leaky integrate-and-fire equation. More advanced GLIFs attempt to model variable spike threshold, afterspike currents, and threshold adaptation.
For more detailed information on each of the models, see the Documentation.
Model Name
Description
1. Leaky Integrate and Fire (LIF)
Standard circuit representation of a resistor and capacitor in parallel with a leaky membrane.
2. LIF + Reset Rules (LIF-R)/td>
LIF with biologically-derived threshold and voltage reset rules in addition to a biologically derived threshold decay.
3. LIF + Afterspike Currents (LIF-ASC)
LIF with spike-induced currents to model long-term effects of voltage-activated ion channels.
4. LIF-R + Afterspike Currents (LIF-R-ASC)
LIF with additional Reset Rules and Afterspike Currents.
5. LIF-R-ASC + Threshold Adaptation (LIF-R-ASC-A)
All of the above, with an additional voltage-dependent component of threshold.
Biophysically realistic, single-neuron model with passive dendrites and active soma.
Biophysical-All Active
Biophysically realistic, single-neuron model with active conductances everywhere.
Data access and download
As indicated above, you can download electrophysiology recordings, morphology image data, 3D reconstructions and neuronal model parameters using links in the electrophysiology and morphology details pages for a cell.
You can also access the data programatically and obtain sample code to run your own model simulations. For more details go to the Download page.