In Situ Hybridization ISH Data
Viewing Gene Expression Data
The Allen Mouse Brain Atlas offers the following ways for you to find gene expression data:
- Use Gene Search to locate genes’ data by name, symbol, NCBI accession number, or Entrez Gene ID.
- You can also use Gene Search with Boolean operators on specific field names using Boolean Syntax Query.
- Search for genes with enhanced expression by anatomic region using Differential Search.
- Search for manually curated enhanced gene expression data from 75 small structures using the Fine Structure Annotation.
- Differential Search across both the mouse and human gene expression datasets using the Human Differential Search.
- Search Related Studies for gene expression in our Sleep Study or our Mouse Strains Study.
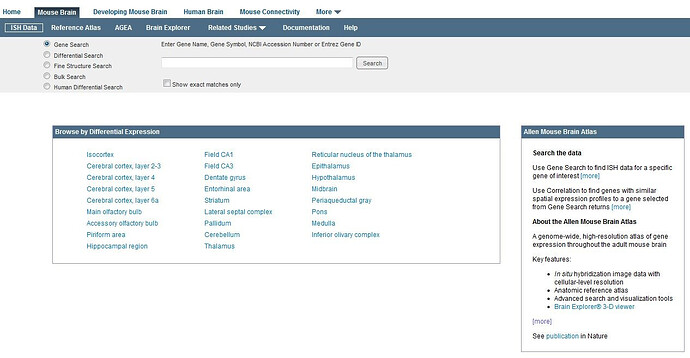
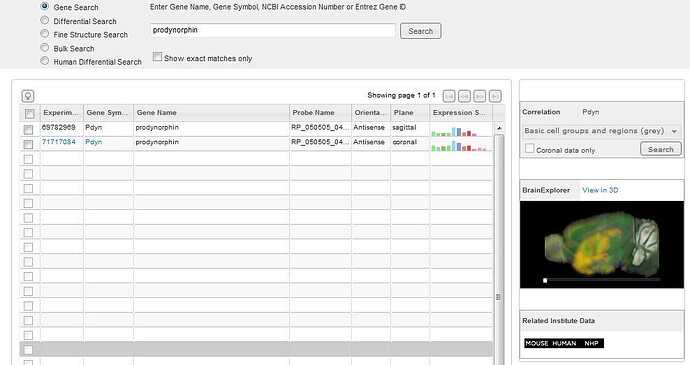
Gene Search
To search for a specific gene by name, symbol, NCBI accession number, or Entrez gene ID, type your query into the text box, making sure the “Gene Search” radio button is selected. As you type, genes that match your search string will be suggested to you. Select an item from the list and click the “Search” button. The results are displayed in a list that shows all genes with expression data that match your query.
Tips for searching:
- If you are unsure of spelling, begin typing the gene identifier and suggestions will be offered.
- Press the ‘Enter’ key instead of clicking the “Search” button.
- Include an asterisk (*) as a wildcard character before or after your search text to return genes that start with or end with that text. For example, enter pig* to return genes that start with pig or *pig to return genes that end with pig.
- If you do not include an asterisk (*) wildcard character, wildcards are implied to surround your search text. So if you search using the text pig, for example, you’ll get results that include pig anywhere within the gene name or symbol.
- Select the “Show exact matches only” check box to remove the implied wildcards. This is useful if you want to return only those genes that exactly match your search text.
- Place the search text within quotes to include spaces or special characters.
- Click the “Bulk Search” radio button to search for many genes at once. Doing so expands the text box, making it easier to copy and paste a list of genes from a text file or spreadsheet. Comma and semi-colon are not valid separators for genes; use tab or | instead. The bulk query does not implicitly include wildcard characters around your search text (you must specify them).
Boolean Syntax Query
The following special operators can be used to build queries:
- AND, OR and NOT must be upper case.
- The AND function is implicit, so spaces between words that are not separated by an operator will be treated like AND.
- OR has higher operator precedence than AND.
- Parentheses can be used to group criteria, but nested parentheses are not supported at this time.
Differential Search
The Differential Search option is ideal to search for gene expression data when the brain structure or area is known but little is known about genes that may be expressed in that area. To find genes with enhanced expression in one or more brain regions in contrast to one or more different regions, first select the “Differential Search” radio button. Enter the target structure(s) in the top search box labeled “Target Structure(s)” with a comma separating each structure. You can then enter “Grey” (for grey matter) or some smaller region as your contrast region in the “Contrast Structure(s)” search box, then click on the Search button.
The results are displayed as a list of genes with enhanced expression in the regions that match your query.
Differential search is an on-the-fly search service. Calculations over all ~25 000 experiments are computed as a fold change using expression energy data from one hemisphere. To restrict the search to coronal experiments (~4 000) which used data from both hemispheres, select the “Coronal data only” check box.
Since this search service is derived from a fully automated processing pipeline, false positive and false negative results can occur due to artifacts on the tissue section or slide and/or algorithmic inaccuracies. Users should confirm results with visual inspection of the ISH images. The “Expression threshold ” slider may be useful to reduce false positive results due to dark spot artifacts. This threshold restricts the list of returned results by excluding any experiment where the expression energy of the target structures is less than threshold.
Fine Structure Annotation
A differential search with manually curated results was generated for 75 small structures in the brain listing the top 50 genes with specific and enhanced gene expression. To use the Fine Structure search, select the “Fine Structure Annotation” radio button, then select a brain region from the drop down menu to return this list.
Human Differential Search
The “Human Differential Search” function enables side by side viewing and comparison of differential search across the mouse ISH and human microarray datasets. Select the “Human Differential Search” radio button. To find genes with higher expression in one structure compared to another structure, select a target brain structure in the top drop-down box and a contrast region in the bottom drop-down box and click on the Search button.
Search results
The return list is generated by first executing a differential search query in the mouse ISH dataset. Experiments for each gene are grouped together and ordered by maximum fold-change. For each gene in the mouse ISH return list, associated experiments in the human microarray dataset are identified; fold-change values are computed and displayed. Note that NCBI HomoloGene data is used to link genes across organisms. Click on the dataset column heading to toggle the primary dataset selection.
For each experiment, a gestalt visualization of the brain wide expression pattern is also provided. The type of visualization depends on the dataset:
For mouse brain data, expression is visualized as rotating 3D thumbnails. Each view is generated by maximum density projection where denser expression area appears more solid and obscures areas of lower density. Each cube is color-coded by average expression intensity ranging from blue (low intensity) through green to red (high intensity). Move slider bar in the header to rotate thumbnail.
For human brain data, microarray data is visualized as a heatmap where each column represents a tissue sample in ontological order. Heatmap color represents the z-score over a probe ranging from green (z-score of -3 and below) through black to red (z-score of +3 and above). Hover over any position in the heatmap to obtain the associated tissue sample structural annotation.

Correlative Search
In using gene expression databases, a “search by example” feature is also highly desirable as genes with similar expression patterns may be related in function. The Correlative Search utility will accomplish this function. This search by example facility is also available in the Allen Human Brain Atlas, Allen Developing Mouse Brain Atlas and the BrainSpan atlas of the developing human brain.
Once you have identified a gene of interest, to find other genes with spatial expression profiles similar to your gene of interest, first select your experiment by clicking on the gene name in the search results list. You will see that the experiment loads in the panel to the right hand side of the results list. Select the brain structure(s) in which you would like to see a similar expression pattern from the drop-down menu. You can search all the data or just the coronal data, by clicking the “Search Coronal Data Only” box, and click “Search”. This action will return experiments with a similar expression profile to brain region(s) in which you are interested.
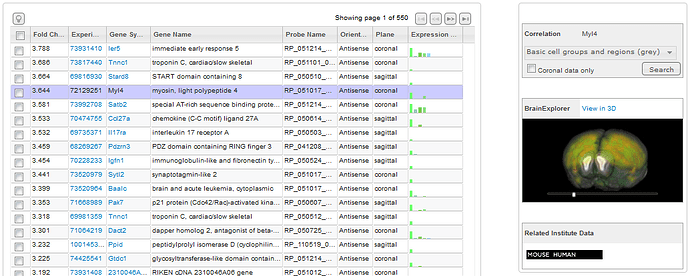
Viewing Search Results
Searches will return a list of experiments based on the input search criteria. Each row includes the following information.
Select the experiments to view in greater detail by clicking on the checkboxes next to your experiments of interest. Experiments will be saved in your cache until you select the “Clear Selections” button at the bottom of the page. After selecting one or more experiments, click the “View Selections” button.
You can look for genes with a similar expression profile to your gene of interest by using the Correlative Search option: once a gene is selected, choose a structure from the drop-down menu and click “Search”. You can limit your results to only the data collected in the coronal plane by selecting the “Coronal data only” radio button.
Experiment Image Viewer
The experiment image viewer displays images for each selected experiment in a Zoom and Pan viewer. This view makes it easy to compare experiments with each other and with the Reference Atlas.
Multiple image series can be opened on the same page to enable side-by-side comparisons. Arrange the experiments by dragging a viewer by the title bar and dropping in a new location. Add a reference atlas by selecting one in the “Atlases” drop-down menu in the upper-right hand corner of the window.
If you are viewing more than one experiment, open the configuration options to change the number of columns displayed in the window. The configuration options are accessible by clicking on the button with a “gear” icon to the right of the “Atlases” menu.
The gene symbol is displayed in the title bar along with the Allen Institute image series ID. Additional details are displayed across the top of the viewing area, including the image index, tissue index, and tissue location.
Thumbnails for the entire image series are displayed across the bottom of the viewer in section order. Click a thumbnail to select it for viewing, or use the keyboard to navigate through the set. The current selection is outlined in black.
Experimental Detail
When the experiment is selected by clicking on the link, a summary of the experimental detail is returned. The data includes 1) an interactive 3-dimensional representation of gene expression, 2) a histogram of the expression energy in 12 different structures, 3) probe and gene metadata and 4) an interactive image viewer that displays the images in the experiment.
Hovering your mouse over the histogram will sync the image in the single image viewer with the section corresponding to that structure and expression.

Using the Zoom and Pan (ZAP) Image Viewer

The Zoom and Pan (ZAP) Image Viewer is a powerful tool to navigate and view the images in an experiment. The main part of the viewer is an interactive window where an image can be repositioned by dragging with a mouse. Use the scroll wheel or the keyboard to zoom in or out.
Select other images in the experiment by clicking on a thumbnail image below the main viewer.
Scale Bar
Drag the scale bar with your mouse to the desired location. Click on the text with your mouse to toggle between horizontal and vertical.
Using the ZAP Viewer Toolbar
Use the toolbar to take actions on the image that currently has focus. Toolbar controls include:
| Control | Function |
|---|---|
| Move the slider bar to the left to intensify the contrast or color | |
| Select ISH, Nissl or Expression image type | |
| Display all thumbnail images in a single ‘contact sheet’ | |
| Open the selected image in the image viewer tool | |
| Synchronize all other Zap viewers on the page that support synchronization to the currently selected image | |
| Open a new browser window to review metadata for the image series | |
| Close the Zap viewer |
Keyboard Commands
Use the keyboard to navigate through the image series and synchronize the viewers on the page. Keyboard commands include:
You can also use the arrow keys to pan the current image.
Expression Energy
The expression mask image display highlights those cells that have the highest probability of gene expression using a heat map color scale (from low/blue to high/red).

The Expression Energy was calculated as follows: Within a given area A (voxel or structure), expression energy = (sum of intensity of expressing pixels in A) / (sum of all pixels in A)
Using the High Resolution Image Viewer
The image viewer enables you to view a high resolution image in its own re-sizable window. It is possible to open multiple images by opening multiple windows.

Ways to interact with an image include:
- Use the on screen navigation buttons to zoom, pan and move forward or backward through the image series. You can also use the Keyboard Commands used in the ZAP Image viewer.
- Drag the scale bar with your mouse to the desired location. Click the text with your mouse to toggle between horizontal and vertical.
- Use the Configuration Menu to download images and adjust image parameters.
- Use the Interactive Atlas Viewer to view the reference atlas along side the ISH images