Quantified Data By Structures

Data from our large scale gene expression and connectivity products is processed through an informatics data analysis pipeline to obtain spatially mapped quantified expression/projection information.
Reference Atlases
Quantified data is available for the following:


The output of the pipeline are quantified values at a grid voxel level. Quantified values can be computed for each structure delineated in the associated reference atlas by combining or unionizing grid voxels with the same 3-D structural label. While the reference atlas is typically annotated at the lowest level of the ontology tree, statistics at upper level structures can be obtained by combining measurements of the hierarchical children to obtain statistics for the parent structure.
Expression statistics are encapsulated as a StructureUnionize object associated with one Structure and one SectionDataSet.
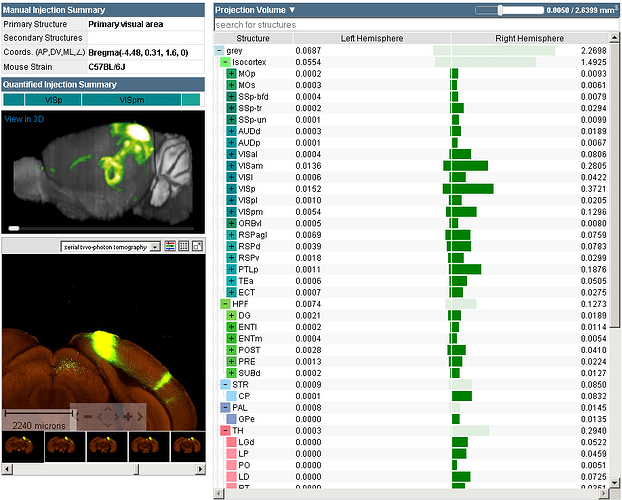
Projection statistics are encapsulated as a ProjectionStructureUnionize object associated with one Structure, either left, right or both Hemispheres and one SectionDataSet.
StructureUnionize and ProjectionStructureUnionize data can be downloaded via RMA and are used in the web application to display expression summary bar graphs for a set of coarse structures. Its usage is also demonstrated in the “structure networks” example application.
Refer to the atlas API pages for further details.