Rna Sequencing Of The Aging Dementia And TBI Project
To complement the protein quantification and histological analysis of tissues from this cohort, RNA Sequencing was run on 377 samples taken from cortical grey (parietal and temporal) and white matter (parietal) and hippocampus, with a minimum of 30M 50bp paired-end reads per sample.
Searching
Searching is available using three methods: (1) Gene Search, when looking for a specific gene of interest, (2) Differential Search, to find enhanced gene expression when comparing different brain regions and donors and 3) Correlative Search, to find regions and donors that exhibit similar gene expression to a “seed gene” selected from the results of a Gene or a Differential search.
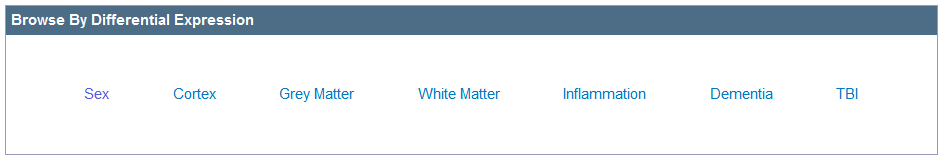
To browse curated differential searches, click on the desired search term from the RNA-Seq landing page.
Gene Search
When searching for a specific gene of interest, type the unique identifier into the “Filter by Gene Name, Gene Symbol or Entrez Gene ID” text box and either hit enter or click “Search”. You can also narrow your search by selecting a brain region(s) and/or filtering by donor. Default searches query over all donors and all regions. Your search results will open in a heat map viewer.

Differential Search
Without a specific gene marker to initiate your search, a differential search can be useful in that it will look for genes enhanced in the brain region or donor you are interested in. To perform a differential search, you must select target and contrasting brain regions and donors. Select one or more brain regions from the drop-down menus. Filtering by donors requires selecting from the matrix that opens when you click in either text box. The toggle switch to the right of the text boxes will exchange the Target and Contrast selections.
Once you have selected your search criteria, clicking “Search” will open up your results in a heatmap viewer.
Donor Selection
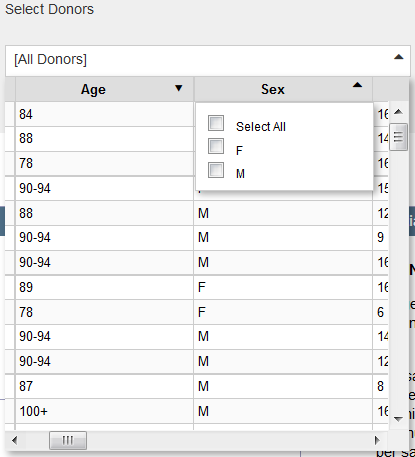
Each of the different search methods provides an opportunity to limit the donors based on metadata collected in the study. To filter the data, click in the text box associated with donor choice to open a matrix. Filter the parameters by selecting the arrow in the column headers to choose parameters. Filter parameters are listed in the table below. For more information regarding the data collected on this cohort, please see the ACT Cohort whitepaper in Documentation.
Search Results
Once you have conducted a gene or differential search or have selected one of the curated searches, your results will be loaded into a heatmap viewer. Once you have clicked on a data point in the heat map, metadata will be populated in the summary above the heatmap.
Metadata Summary
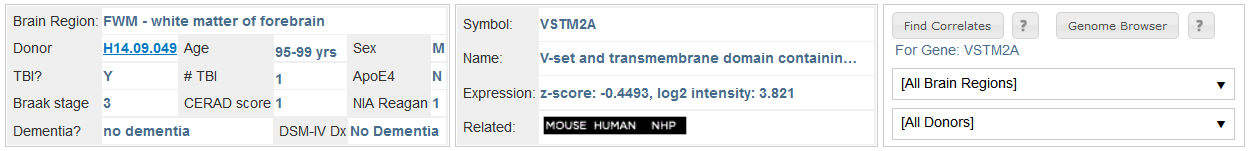
The metadata summary outlines several of the donor categories, metadata on the gene (including symbol, name, expression values and related data) and the find correlates and Genome Browser functions.
Heatmap Viewer
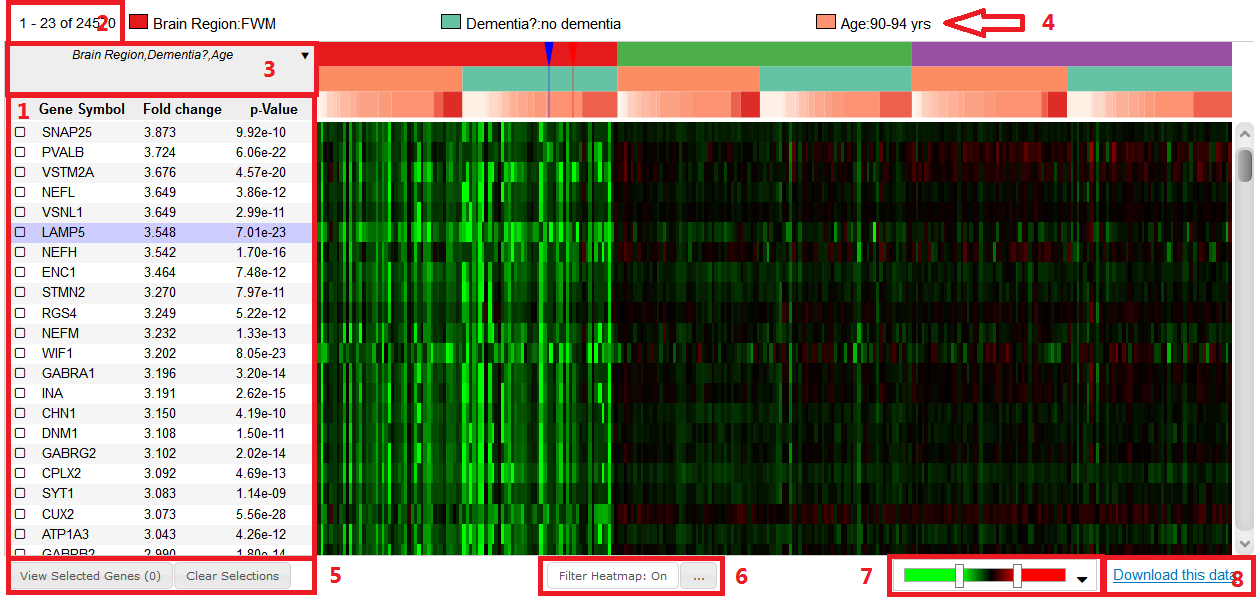
- Gene List: List of genes defined by the search criteria by gene symbol. When the list is a result of a differential search, each gene will be accompanied by both a “Fold Change” and “p-value”. Selecting those column headers will toggle the gene list to that parameter. When the list is the result of a correlative search each gene will be accompanied by a Pearson’s correlation, r.
- Number of Genes: Number of genes that fit the search criteria.
- Column Headers: Clicking in this box will allow you to change the initial sort parameters of the column headers
- Classification: Indicates the column headers consistent with the currently highlighted data point (where the mouse is hovering)
- Gene Selection: Select genes by clicking on the checkbox next to the gene symbol in the gene list. View a heatmap with only selected genes by clicking “View Selected Genes”. Genes will be available for viewing until you click “Clear Selections” or clear your cache.
- Filter Heatmap Function: To limit the amount of data displayed in the heat map use this function.
- Color Map: Use this function to change the way the z-scored data is displayed or to view the log2 FPKM data.
- Download: This link initiates download of the current heatmap data.
Column Sorting

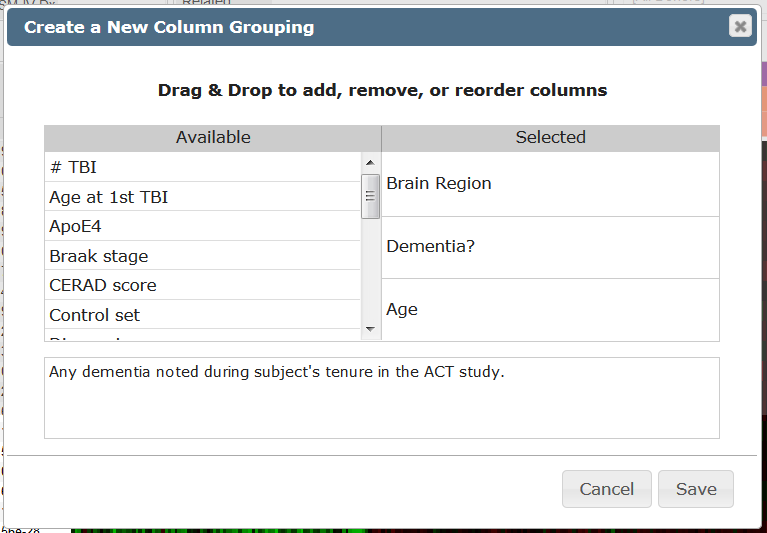
The column headers on the x-axis of the heat map are a feature that can be changed by the user. By default, the column headers are Brain Region, Dementia? and Age (in that order), but any of the donor parameters can be used to sort the columns. Clicking the arrow in the box in the upper left-hand corner of the heatmap will open a list of groupings including any customized groupings that the user has created. To create a new grouping, click on “[Create new grouping…]”, and a window will open allowing you to create a new grouping. Remember to save your selection.
To remove a grouping, hover the mouse over the grouping and a garbage can will appear, click the can to remove the grouping.
Filter Heatmap
To restrict the amount of data that are displayed in the heatmap, select the “Filter Heatmap” button below the heatmap. Filtering your heatmap is a two-step process: first, select the “…” box to restrict your features, making sure to save your selections, and then toggle the filter heatmap feature between “On” and “Off” by clicking the “Filter Heatmap” button.
Download Heatmap Data
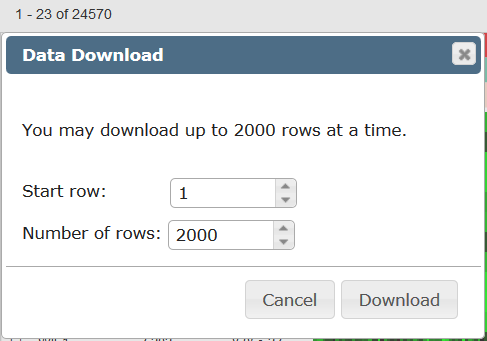
Once you have found the data that you are interested in downloading and analyzing off-line, click on the “Download this data” link. There is a limit to the amount of data you can download at one time, choosing the start row and number of rows (up to 2000) a download of three .csv files; one with metadata for the rows, one for the columns and a matrix containing the FPKM values.
Color Map

To change the contrast of the heatmap display, click and drag the slider bars in the color scale below the heatmap. Clicking on the scale will open a window allowing the user to choose from several color scales or the log2 FPKM view.
Correlative Search
Once you have found a gene of interest either by performing a gene or differential search, you can look for brain regions or donors that show a similar pattern of gene expression using the “Find Correlates” feature.
From the heatmap, click on a gene to load that “seed gene” into the search box. You have the option to select a brain region(s) and or donor metadata before clicking “Search”. All genes with similar expression patterns as your seed gene will then be displayed in the heat map. If you filtered your search by region or donor, your heatmap will only display those features. Turn off the “Filter Heatmap” function to see all the data.
Genome Browser

Once you have selected a seed gene and donor (by clicking on the heatmap), that gene and donor will be available to load into the Genome Browser. If specific donors are not listed in the Donor text box, only the donor associated with the data point selected will be loaded into the genome browser. To load more than one donor, select multiple donors from the donor drop down menu.
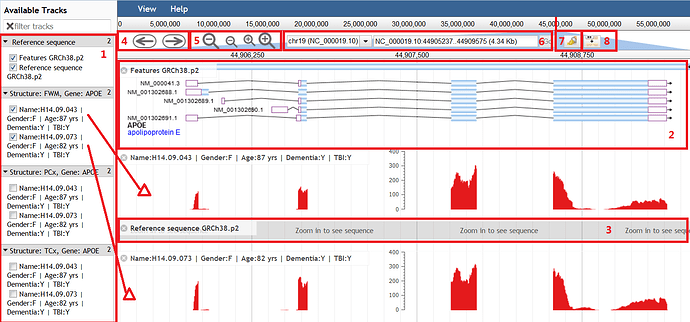
- Available Tracks: Data that is available to be shown in the main viewer is listed in this box. Example in the above figure points to the gene model (2), the reference genome sequence (3), and the reads from 2 donors from the study. The histograms are the number of reads aligned to the reference transcriptome sequence.
- Gene Model: Representation of the gene and its variants, showing exons as boxes and introns as lines.
- Reference Genome: Zooming into a specific exon will eventually reveal the sequence of the reference genome (GRCh38.p2) that the reads were mapped to.
- Scroll Bars: Click on arrows to step along the chromosome.
- Zoom: Click on the magnifying glasses to zoom in or out of the genome. Zooming in will reveal the reference genome sequence at the nucleotide level.
- Chromosome Location: Location of the gene on the chromosome.
- Highlighter: Click this button and then click and drag to high light the data.
- Hide/Show Track Titles: Click on this button to hide or show the track titles that can obscure the data.