Brain Explorer® 3-D Viewer is an application for viewing brain anatomy, gene expression and fluorescence projection data in three dimensions in the framework of the Allen Reference Atlas.
Using Brain Explorer, you can:
• View a fully interactive version of the Allen Reference Atlas in 3-D.
• View gene expression data in 3-D at 200 µm3 resolution.
• View projection data in 3-D at 100 µm3 resolution.
• View expression data and projection data from multiple experiments superimposed on each other in 3-D.
• Navigate the high-resolution 2-D ISH and projection images using the 3-D model.
• Link to associated gene metadata on the Allen Mouse Brain Atlas web application.
• Operating System: Microsoft Windows 7
• CPU: Intel Core Duo or AMD 1.8GHz
• System Memory: 1GB
• Graphics Card: Hardware 3D OpenGL accelerated AGP or PCI Express with 64MB RAM
• Screen: 1024x768, 32-bit true color
• Hard Disk: 200MB free space
Note: Brain Explorer is known to work with the following video chipsets: nVidia GeForce 9400/9600, nVidia Quadro FX 1800/3800/5600, AMD Radeon 9600, AMD Radeon HD 3200/4550, Intel Q35/Q45 Express.
For the best performance, please check with your video card vendor for the latest available drivers before using Brain Explorer. The Windows version of the Brain Explorer viewer is available here. Double-click the downloaded BrainExplorer2.msi file and follow the prompts.
• Operating System: OS X 10.6.8
• CPU: Intel 1.8GHz
• System Memory: 1GB
• Graphics Card: 3D-capable with 64MB RAM
• Screen: 1024x768, 32-bit millions of colors
• Hard Disk: 200MB free space
Note: Please install the latest system updates from Apple to ensure you have the latest video card drivers.
The Mac version of the Brain Explorer viewer is available here. Double-click the downloaded zip file to unpack Brain Explorer.
A one-time download containing anatomy files is needed following installation of the Brain Explorer application. The first time you open the Brain Explorer software, you will be asked to choose to download files for the Allen Developing Mouse and Allen Human Brain atlases. Click on the atlases you would like to use and then click the Install button.
To download missing atlases on the PC, go to the Help menu and select Download Atlases. On the Mac, the command is in the Brain Explorer 2 menu.
The Brain Explorer application will inform you when updates to the Brain Explorer application itself or its atlases are available. New data may not be available for viewing until you install the required updates.
To load projection data into the Brain Explorer viewer, go to the Allen Mouse Brain Connectivity Atlas and perform an efferent search. You can also select a structure name from the list of injection sites. Your search brings back a list of experiments. Click on a row to select an experiment of interest. A 3-D thumbnail of the projection data of that experiment will appear to the right. Click on the blue “View in 3D” file link to launch the Brain Explorer application.

When the Brain Explorer 3-D Viewer opens, you will be taken to a screen that displays the Image Viewer, the Structure Ontology Viewer, and the Gene/Projection List.
The Image Viewer displays a 3-D representation of the neuronal projections in the selected experiment. Each sphere (when present) represents the injection site re-sampled to a 100 micron grid resolution. Each line traces fluorescent signal through the brain and each cube represents termination of signal. Larger polygons corresponds to a greater density of signal. Gene expression data can be displayed concurrently with the projection data. Gene expression will also be represented by spheres as described in here.
You can select a sphere or cube by clicking on it. Volumes can be deselected by clicking on blank space. The original projection section of the selected sphere/cube will be displayed blended with the projection segmentation in the lower left hand portion of the screen. The blending can be adjusted by selecting Image Controls from the View menu and moving the Image Blending slider. Clicking on the arrow in the projection image will open the corresponding image in a high resolution image viewer.
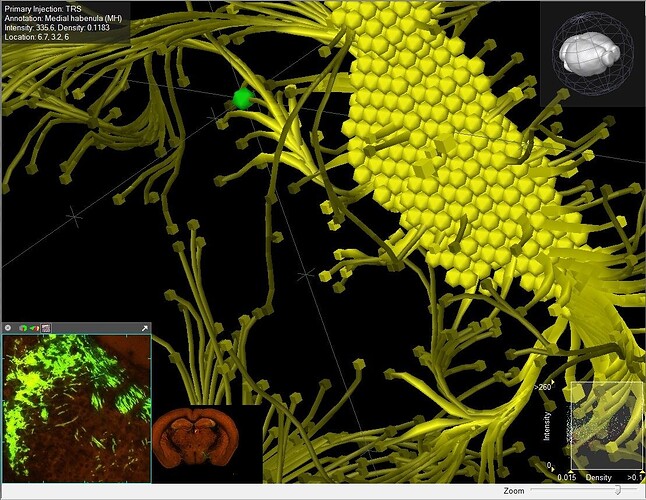
The information at the upper left corner of the main Brain Explorer window summarizes the fluorescent signal detected in the selected grid location. This information includes the primary injection site, the annotated location of the selected point, average signal density and intensity (over pixels) and the location. The Informatics Data Processing White Paper describes how the measurements were obtained.
To change the projection signal representation, click on the “Data” tab in the top left hand corner of your screen and select an option under “Raw” colors.
A compass in the right-hand corner of the Image Viewer can be used to rotate the brain by clicking and dragging your cursor. You can zoom using either the wheel on your mouse or using the Zoom scrollbar in the lower right hand corner of the Image Viewer.
A way to control projection visibility is by setting thresholds on projection signal values. This method can restrict visible signals to different combinations such as low intensity and low density or high intensity and low density.
The graph in the lower right hand corner shows a dot for each streamline endpoint, shown as a cube, in a projection experiment. The color of the dot corresponds to the anatomic annotation in the same way the atlas colors display mode works. Each data point is plotted according to its density on the x-axis and its intensity on the y-axis.
The thresholds can be changed by resizing the white box. Any edge or corner of the box can be clicked and dragged to re-size it. You can also click and drag in the center of the box to move the box.
The Structure Ontology Viewer shows the entire collapsible ontology for the mouse brain as defined by the Allen Reference Atlas. Two columns to the right of the ontology determine the type of data displayed in the Image Viewer. “A” represents annotation and when checked, will show a visual representation of that structure in the Image Viewer. “D” represents signal density and when checked, will show signal in that structural domain.
The default organization for the Structure Ontology is the Hierarchical View, but if you are unfamiliar with the ontology, you can click on the Alphabetical View to see the structure list in alphabetical order.
The Bookmarks tab is a space where you can create and save favorite views of the brain. Several default views are already saved that will rotate the brain back into common viewing frames.

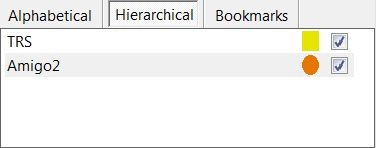
This section displays projection experiments you have selected as well as any gene expression experiments you have downloaded in this session. Projection data is indicated by a colored square, gene expression by a colored circle. Right clicking on the gene name or injection site will bring up a menu where you can, 1) view the gene or experiment detail page (Get Info), 2) be taken to a zoomed in image from this experiment (View Images), 3) copy meta information to the clipboard, such as symbol, name, Entrez ID, image-series ID (Copy Info), 4) activate a “Find Correlates” search finding experiments with similar profiles (Find Similar) or 5) close the experiment and remove it from the list and the 3-D view (Close).
To search for genes within the Brain Explorer application: go to the Search box located above the ontology panel and type in the gene symbol or part of a gene name.
The list of results shows gene name, gene symbol along with a 3-D summary thumbnail of the expression for each experiment matching the search. The expression thumbnail represents a maximum expression projection rendering: the denser the expression in a region the more “solid” the appearance. Reference atlas colors are additionally layered on top.
To load an experiment for viewing click on the “Download” button under the gene name.

: Selects cursor rotation tool mode

: Selects cursor pan tool mode

: Selects cursor selection tool mode

: Toggle Sagittal Atlas section viewing

: Toggle Coronal Atlas section viewing

: Toggle Horizontal Atlas section viewing

: Centers the Viewer on the current pinpointed expression data point

: Turns on the cutting planes

: Toggles the Structure Ontology and Gene List View
You can show opaque three dimensional structures of the brain by “showing” or “hiding” structures from this menu. The “Transparent” function allows you to see transparent views of the structures to view the anatomical relationships between them.
Selecting the sagittal, coronal or horizontal sections (or clicking on one of the section image buttons in the toolbar) will superimpose a single plane of the Nissl images from each brain on your image space. These planes can be moved once the selection tool mode button in the toolbar is selected. Selecting “Show Annotation on Section” from this menu will color the Nissl images according to the brain structure ontology.
Select “Show Full Resolution Image” to link to the high resolution annotation reference atlas images.
The Data Tab menu allows to you to show all signal, hide all signal (for instance to then select a single structure) or toggle expression (for instance, unselect your region of interest then toggle to see signal in only that region).
You can also show or remove threshold controls and choose the visual representation of your data from this menu. There are several options under “Raw” colors:
To be taken to the experiment contact sheet page, select “Get Info”. To see a high resolution view of the images in this experiment choose “View Images”. These functions are also available by right-clicking on the injection site/gene name in the Gene/Projection List.
Choose “Find Similar” to find similar experiments to the selected experiment. This uses the same NeuroBlast functionality as in the web application.
When this function is selected, either by toggling the cutting tools button in the toolbar or selecting “Clipping Planes” from the View drop down menu, you can make coronal, sagittal or horizontal cuts in your view of the brain and related data. To cut in a particular plane, make sure the cursor is in selection tool mode, and then click and drag on the plane you are interested in clipping.
If you are using a desktop computer, you should obtain drivers from the video card manufacturer. First, identify the video card. Go the Start menu and open the Control Panel. Open the Display control panel and go to the Settings tab. Click the Advanced button and go to the Adapter tab. Your video card vendor and model name will be displayed at the top of the window under Adapter Type. Please go to the manufacturer’s web site, locate the driver download, and follow the instructions on the website or included with the downloaded file.
If you are using a laptop computer, you will need to go to your laptop manufacturer’s web site to locate the latest video drivers.
You can also activate an alternate drawing mode in Brain Explorer. Go to the View menu and select Options. Check the Draw faster but at lower quality button and uncheck the Synchronize drawing with the monitor’s vertical refresh button. Set the Multisample setting to Off.
If you are using multiple video cards from different vendors, the 3-D display may not work correctly on all attached monitors.
Use the Add/Remove Programs control panel or the uninstall link in the Brain Explorer folder in the Start menu. Additional data that are not automatically uninstalled are located at the following locations:
Windows XP
Atlas data: C:\Documents and Settings\userid\Local Settings\Application Data\Allen Institute\Brain Explorer 2
User settings: C:\Documents and Settings\userid\Application Data\Allen Institute\Brain Explorer 2
Windows Vista and Windows 7
Atlas data: C:\Users\userid\AppData\Local\Allen Institute\Brain Explorer 2
User settings: C:\Users\userid\AppData\Roaming\Allen Institute\Brain Explorer 2
If you use a proxy server, the Brain Explorer application will use the proxy settings from the Internet Options control panel in the Windows Start menu. Please refer to the Windows documentation for help on proxy settings.
Drag the Brain Explorer 2 icon to the trash. The Brain Explorer application generates the following files, which can also be dragged to the trash.
If the Brain Explorer application is not running smoothly, first try to free up as much memory as possible by quitting all other open applications. You can also activate an alternate drawing mode. Go to the Brain Explorer 2 menu and select Preferences. Check the Draw faster but at lower quality button and uncheck the Synchronize drawing with the monitor’s vertical refresh button. Set Multisampling to Off.

Learn about Projection Dataset with comprehensive guides and examples from Allen Institute for Brain Science.
The Adult Mouse Connectivity Atlas comprises a searchable image database of axonal projections labeled by viral (rAAV) tracers and visualized using serial two-photon tomography.
Search this dataset using:
1. Source Search which allows searching by injection site (Filter source Structure(s)) and filtering by mouse line, tracer type and the presence of Intrinsic Signal Images

2. Target Search a “virtual retrograde” search that finds experiments based both on injection site and projection through a structure of interest

3. Spatial Search a spatial search allows the user to choose either a target signal or injection site based on selecting a voxel through which signal passes

There are example searches in the Browse Data subject box on the landing page to demonstrate the various ways in which relevant data can be found. You can also browse experiments from the 3-D search result visualization. Hovering your mouse over the dots (colored according to the Reference Atlas) NEED LINK HERE will indicate the primary injection structure of that particular experiment.

Please see the Informatics Data Processing whitepaper available in the Documentation tab for more information on the informatics processing performed in this study.
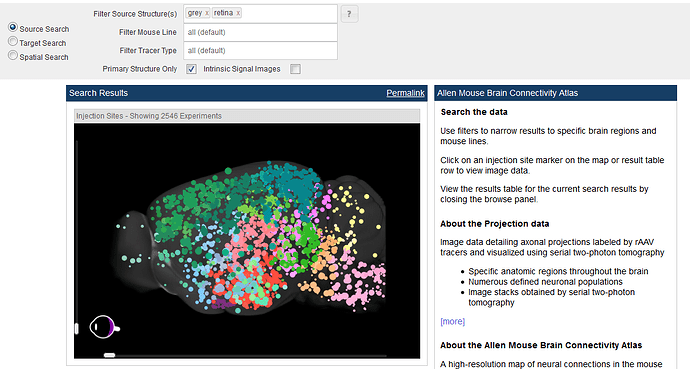
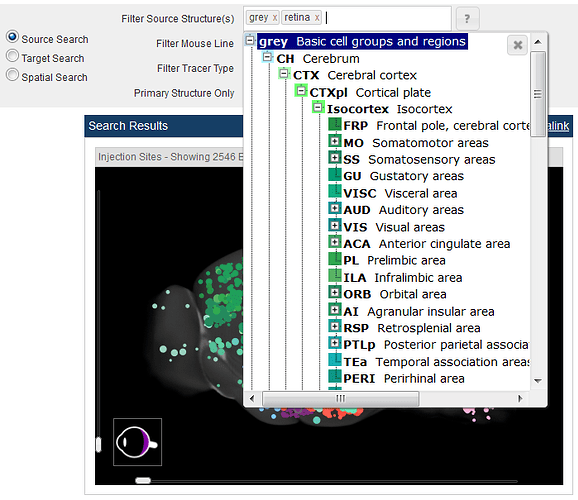
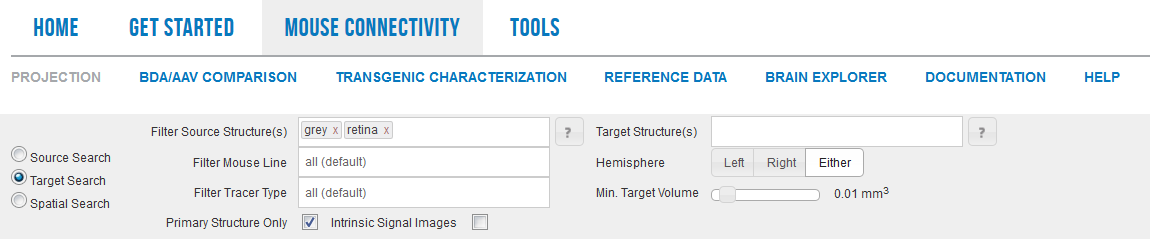
The default view is all experiments throughout the brain (indicated by “grey” and “retina”). To filter your search by injection site, select a structure(s) from the structure ontology that opens when you click in the “Filter Source Structure(s)” text box.

From the Source Search, you also have the option to filter by mouse line or by tracer type. To filter by mouse line, click in the “Filter Mouse Line” text box and select from Wild Type, Cre line or Ai75(RCL-nt) options, or start typing in the text box to search tags from the various Cre-dependent mouse lines. The Ai75 (RCL-nt) option is a reporter strain that we used to target neurons within certain regions. When filtering using the “Filter Tracer Type” text box, you will have the option to choose between EGFP (axonal EGFP) experiments, SypEGFP (synaptophysin-tagged, synaptic EGFP) labeled experiments, or Target EFGP experiments. For more information on this targeting strategy, please see the Overview whitepaper in Documentation.
Although every effort was made to limit the injection site of the viral tracer to a single brain structure, it was often the case that cells in neighboring structures were also infected. We refer to these as “secondary injection structures” and include them in the results list as they may also contain interesting scientific information. To view these experiments as well, uncheck the “Primary Structure Only” box.
As we precisely target the higher visual areas in this data set, experiments utilized Intrinsic Signal Imaging for both guiding injections into the visual cortex, as well as to inform the interpretation of projection pathways. To view experiments that include these data, check the Intrinsic Signal Images box.
As you select filtering parameters, notice that the number of experiments in the 3-D search result visualization decreases to show only the number of experiments that fit your search criteria.
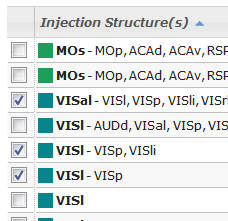
Below the 3-D search result visualization, a list will automatically load with all the experiments that fit your filtering criteria.
This list includes:
Clicking on the column headings will sort the list of experiments by that column, clicking twice on a single column will reverse the sort order. Once you have found a relevant group of experiments, you can save or bookmark these search results using the “Permalink” function.

Several experiments can be selected to view side-by-side and/or in the context of our reference data by checking the boxes next to the experiments. Once you have selected the experiments you want to view, click the “View Selections” button. Those experiments will be available in your cart to view in the Experiment Image Viewer until you clear your cache or click the “Clear Selections” button.

Once you have narrowed your search and want to delve deeper into an individual experiment, open the Experiment Summary View by clicking on a circle in the 3-D search result visualization or an experiment in the list.
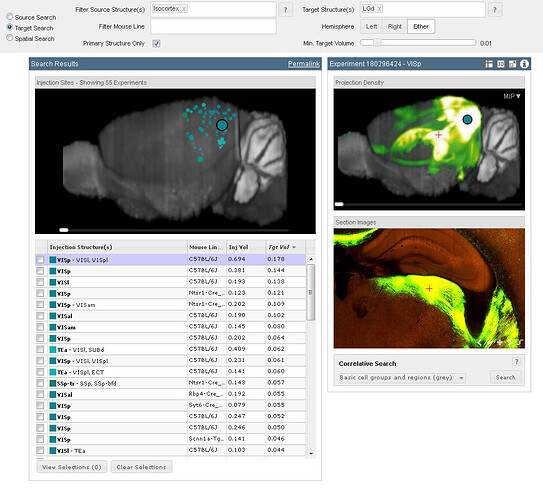
This search has all the same functional capabilities as Source Search with the added ability to filter your search by limiting the results to experiments where the projection signal passes through a given structure(s).

By default, when you click the “Target Search” radio button, the “Target Structure(s)” search box will open. After selecting one or more structures, selecting a hemisphere, or changing the minimum target volume (defaulted to 0.01 cubic mm), the 3-D search result visualization will automatically update with experiments that fit your filtering criteria. The list of experiments under the 3-D search result visualization includes the following information:
Experiments are sorted by the target volume, but can be resorted by clicking on a column header. Once you have found a relevant group of experiments, you can save or bookmark these search results using the “Permalink” function.

Several experiments can be selected to view side-by-side and/or in the context of our reference data by checking the boxes next to the experiments. Once you have selected the experiments you want to view, click the “View Selections” button. Those experiments will be available in your cart to view in the Experiment Image Viewe until you clear your cache or click the “Clear Selections” button.

Once you have narrowed your search and want to delve deeper into an individual experiment, open the Experiment Summary View by clicking on a circle in the 3-D search result visualization or an experiment in the list.
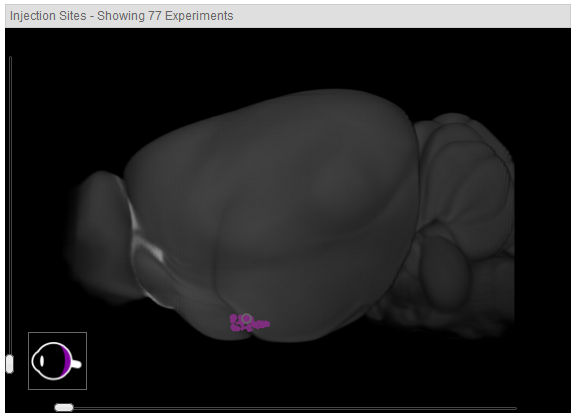
Notice that experiments in the retina can be highlighted by hovering over the eye in the lower left-hand corner of the 3-D visualization or can be selected by clicking on one of the spheres indicating the entry point into the brain.


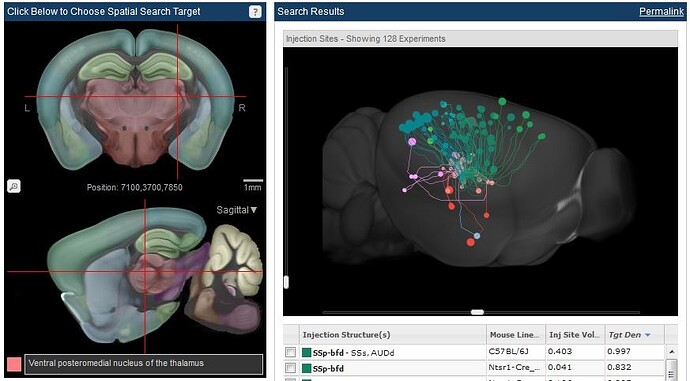
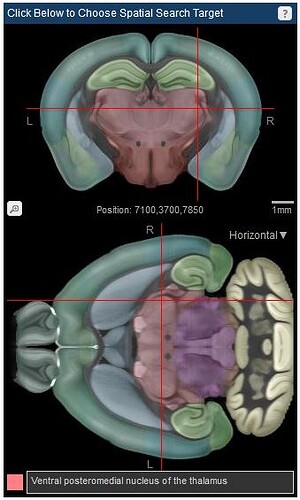
Clicking the “Spatial Search” radio button allows you to do a voxel-based “virtual retrograde” search, or search for injection sites in close proximity to a selected voxel. The default view is pointed to a voxel in the ventral posterolateral nucleus of the thalamus, as indicated by the cross hairs in the multiplanar viewer. The 3-D search result visualization depicts all the injection sites with projection signal through the chosen structure. The approximate injection site is depicted with a sphere and the approximate pathway is traced with a line the same color as the injection site.

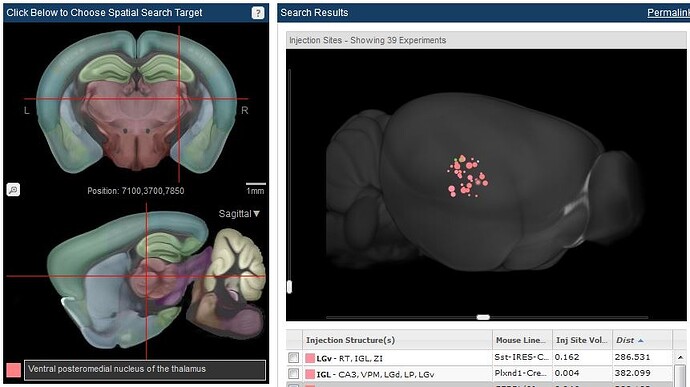
Selecting the “Find Injection Sites” filter will bring up a threshold bar that will allow you to search for injection sites within a specified distance from your cross-hair location.

Click and drag the cross hairs in the multiplanar viewer to select a voxel in a particular structure. Once you have chosen a structure, you can further filter your search by selecting a mouse line and/or filtering by primary injection structure. The resulting list of experiments will include:
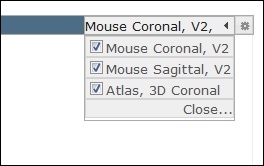
The voxel-based Spatial Search is carried out by using the multiplanar viewer. This viewer illustrates the Allen Mouse Common Coordinate Framework (CCF) and incorporates structures drawn in 3 dimensions: see the Mouse CCF whitepaper in Documentation. Access to the horizontal view is via the drop-down menu in the sagittal view.

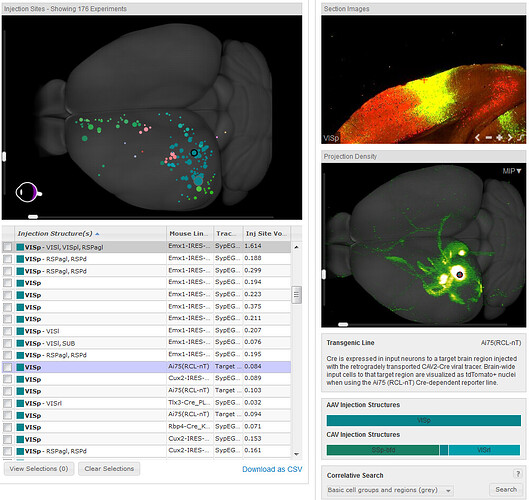
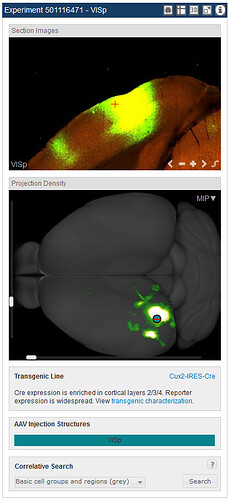
Hovering your mouse over an experiment will highlight that injection site in the 3-D search result visualization. Rotating the image in either the horizontal or vertical planes gives better access to view the selected experiments. To take a closer look at a particular experiment, click on that experiment, either in the list or on the 3-D search result visualization. Once an experiment has been chosen in this manner, a new panel of images and options will load on the right labeled by the Experiment ID number and the injection site structure. This view includes a section images viewer, a projection density image viewer, a transgenic characterization box, an injection summary for the rAAV virus injection and the targeting CAV injection summary (when appropriate) and a correlative search box. Characterization of the transgenic lines used in this study has been carried out, and can be inspected from the link in the Transgenic Characterization box. If viewing an experiment from the Retinal Projectome, a whole mount view of the retina is available from a link in the Transgenic Line box. Experiments that show a similar signal pattern to the current experiment can be searched for using the Correlative Search.

Advanced search features are available from the icons in the toolbar of the experiment panel and include:

Open the experiment in a Cortical Map Viewer also where Intrinsic Signal Images (when available) will be displayed

Shortcut key to conduct a Spatial Search from the point indicated by the cross hairs

Open the experiment in the 3-D Brain Explorer software

Open the experiment in a High Resolution Image Viewer

Open quantification of the signal in the Experimental Detail page

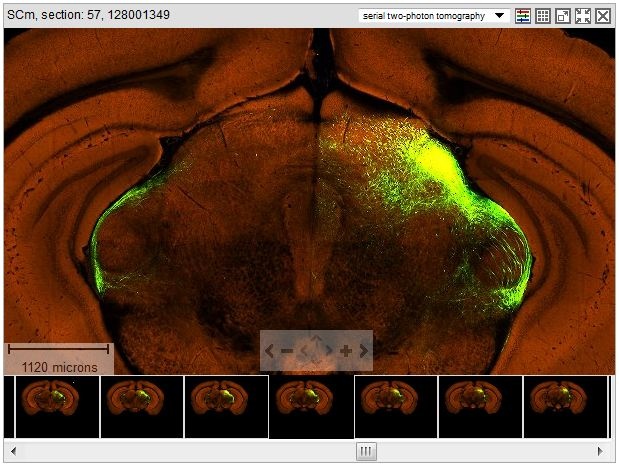
The section images viewer shows the 2-D fluorescence images in both the green (signal) channel and the red (autofluorescence) channel. Navigation (panning and zooming) through these images is achieved by using the on-screen navigation tools or using the Keyboard Commands. This project utilizes extensive informatics processing and the informatics signal calculated by subtracting the background signal (segmentation images) can be viewed by clicking the icon (see below).

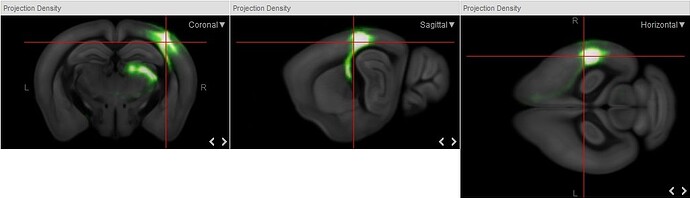
This view shows an interactive 3-D thumbnail view of the experiment in what is referred to as the Maximum Intensity Projection (MIP) view. By default, a cross hair and sphere indicates the center of the injection site. Clicking on any other position in the MIP view will move the cross hair to the site selected both in the MIP view as well as in the 2-D view in the section image view. As selecting a point in a 3-D image can become problematic, you also have an option to view the intensity projection in 2-D from the drop-down menu that opens when you click on “MIP”. These views show the signal intensity against the two dimensional view of the Allen Mouse Common Coordinate Framework (CCF). For more information on the CCF, please see the whitepaper in the Documentation tab.

The left (L) and right (R) sides of the brain are labeled in these views and navigation to the next section is achieved by clicking the < and > on-screen navigation buttons.
An example of the segmentation view is illustrated in the image to the right. For more information on the informatics processing in this project, please see the Informatics Data Processing whitepaper available from the Documentation tab.

Once you have found a relevant experiment, another useful search is for any other experiments that may show similar projection patterns. The correlative search allows you to look for similar patterns with an experiment of interest either by comparing brain wide (default), or by selecting fiber tracts or one of the other 12 major curated brain divisions available from the drop-down menu.
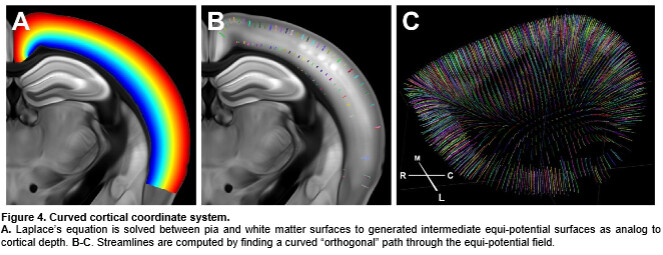
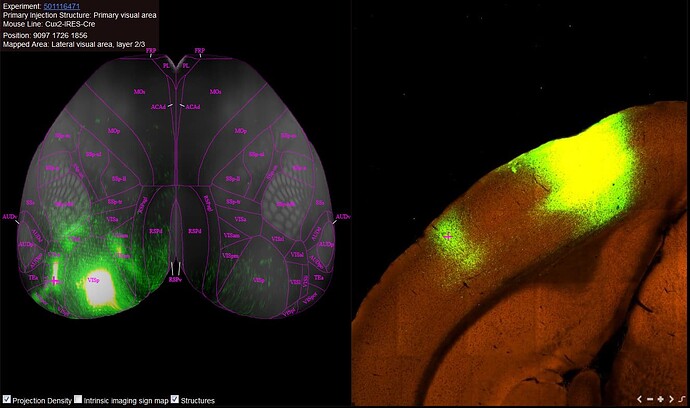
In order to enable the integration of information from different cortical depths, we constructed a curved cortical coordinate system. This coordinate system allows us to project structural features in the cortex, which are often oriented orthogonally to the surface, in a two dimensional plane that preserves structural integrity. When viewing projections in the Cortical Map, you are viewing the cortex along a “streamline” (see figure below and CCF whitepaper in Documentation.


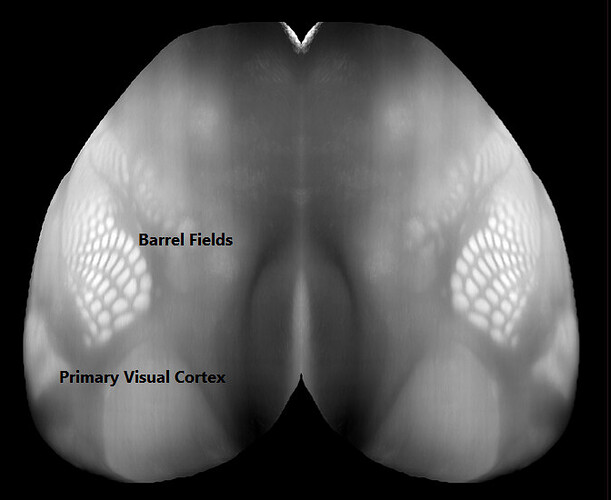
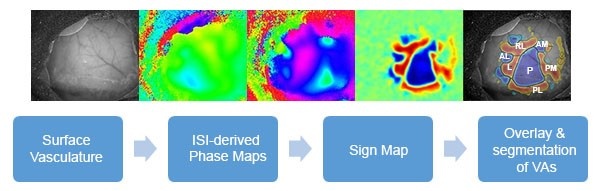
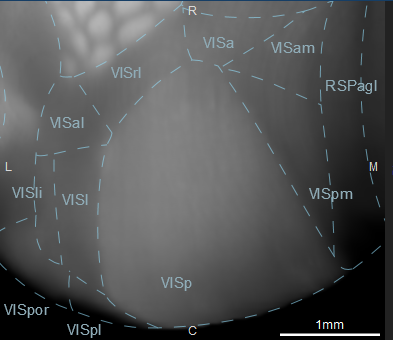
When viewing this curved cortical coordinate system in two dimensions, structures such as the barrel fields in the somatosensory cortex and the primary visual cortex become visually distinct. While the curved cortical map nicely delineates the primary visual cortex, the associated visual areas are not so easily mapped. To further delineate these areas, Intrinsic Signal Imaging was performed during a visual stimulus to create sign maps for each individual brain.

For more information on how the sign maps were generated, please see the Overview whitepaper in Documentation. The March 2016 data release was the first to include experiments that used sign maps to both target infection to specific visual areas as well as interpret projection from other brain regions to the visual areas.

When viewing an experiment of interest, you can visualize that experiment in the cortical map by clicking on the cortical map icon.


Note: only the projection signal in the cortex is visible in the Cortical Map viewer.
The cross-hairs on the Cortical Map indicate the location of the 2-D image from the experiment to the right. Navigation to other locations in the experiment is from either the on-screen navigation icons, or by double-clicking on the Cortical Map itself. Once a location has been chosen, the experimental ID, primary injection site, mouse line, position (in microns) and the location mapped to the reference atlas will show up in the left-hand corner of the screen. Clicking on the experimental ID link will take you to the Experimental Detail Page. Only the Projection Density and Structures checkboxes will be available for experiments without ISI.
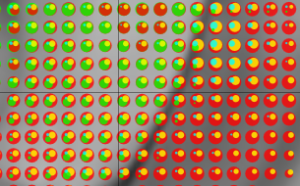
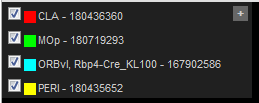
To see experiments that include ISI, make sure to check the “Intrinsic Signal Images” box in your initial search.
Once an experiment with ISI has been selected, a radio button will appear which allows overlay of the projection and ISI views.

The cross-hairs on the Cortical Map indicate the location of the 2-D image from the experiment to the right (not shown). Navigation to other locations in the experiment is from either the on-screen navigation icons, or by double-clicking on the Cortical Map itself. Once a location has been chosen, the experimental ID, primary injection site, mouse line, position (in microns) and the location mapped to the reference atlas will show up in the left-hand corner of the screen. Clicking on the experimental ID link will take you to the Experimental Detail Page.
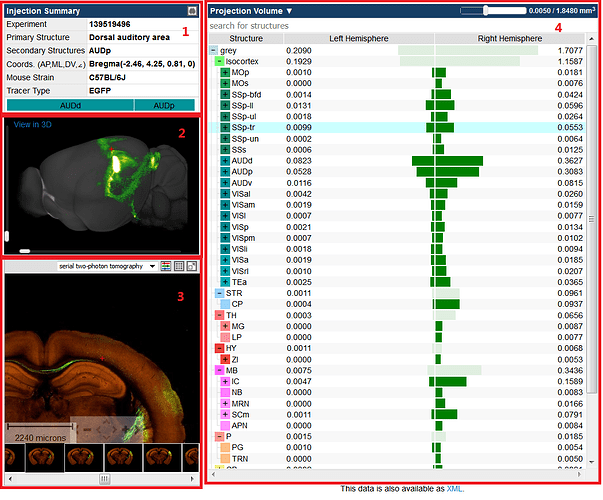
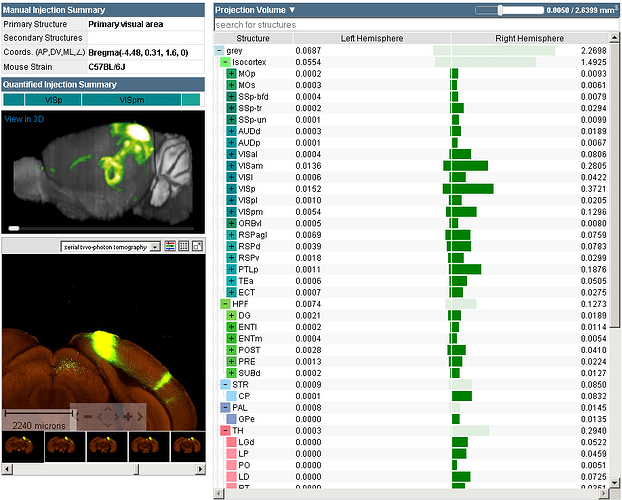
The experimental detail page illustrates the projection experiment in an informatically quantified fashion. This page contains the Injection Summary(ies), a Projection Density Image Viewer, a Section Images Viewer, and a histogram quantifying the signal in each region, displayed either by Projection Volume or Projection Density.

1. Injection Summary: This section includes a link to the Cortical Map Viewer from the icon in the top right-hand corner and lists the experiment ID, primary and secondary injection structure(s), the coordinates of the injection, the mouse strain, tracer type and the calculated injection summary (%) for the rAAV injection and the CAV injection (where appropriate). If the experiment was targeted stereotaxically, the coordinates are from a registration point (typically Bregma) in the anterior/posterior, dorsal/ventral, medial/lateral orientations and the angle of injection (AP, ML, DV, <). If the experiment was targeted using ISI, the coordinates will read “ISI(0, 0, DV, <)” indicating the depth and angle of injection (see Overview whitepaper in Documentation). If the experiment shown is from a transgenic line, you will also have a description of the infected cells and a link to the Transgenic Characterization of that line.
2. Projection Density Image Viewer: This viewer offers a rotating preview of the projection signal in 3 dimensions. Click the “View in 3D” link to view the experiment in the Brain Explorer software.
3. Section Images Viewer The Section Images viewer allows you to browse the experiment in 2-D. You can scroll through thumbnails of each section, zooming in or out and panning through areas of interest.

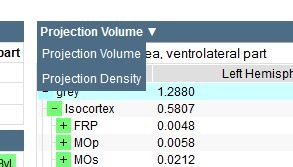
4. Histogram: This section illustrates the quantified signal in each structure either by projection volume (mm3) or by projection density (fraction of area occupied by signal compared to the whole structure). Toggle the two representations of the data using the drop down menu at the top of the histogram. The selected structure ontology can be expanded or collapsed and the number of structures shown can be changed using the threshold slider bar at the top of the histogram. When you click on a structure in the histogram, you will be taken to that area of the brain in the 3-D and 2-D image viewers. A red cross-hair pinpoints the center of that structure in each of the image viewers.
Data from this page can be downloaded as XML.
To view several experiments in a single window, check the boxes next to experiments of interest from the various search methods. Once you have selected “View Selections” a window will open with all your checked experiments. The experiment image view displays images for each selected experiment in a Section Images viewer. This view makes it easy to compare experiments with each other and with the associated reference atlas, and with the Reference Data.

Multiple image series can be opened on the same page to enable side-by-side comparisons. Arrange the experiments by dragging an image viewer by the title bar and dropping into a new location. Add a reference atlas by selecting one from the “Atlases” drop-down menu in the upper-right hand corner of the window (see screenshot).
If you are viewing more than one experiment, open the configuration options to change the number of columns displayed in the window. The configuration options are accessible by clicking on the button with a “gear” icon to the right of the “Atlases” menu.
The injection site, section number and experiment ID are displayed in the title bar. Experiments using transgenic mice will also report the name of the transgenic line. Icons in the toolbar allow for you to take actions on the current image.
To view an overlay of each of the selected experiments in the Experiment Image Viewer, click on the Composite Projection Viewer in the title bar.
The Section Images Viewer is a powerful tool to navigate and view the images in an experiment. The main part of the viewer is an interactive window where an image can be repositioned by dragging with a mouse. Use the scroll wheel, on-screen navigation buttons or the keyboard to zoom in or out.
Thumbnails for the entire image series are displayed across the bottom of the viewer in section order. Click a thumbnail to select it for viewing, or use the keyboard to navigate through the set. The current selection is outlined in black.

Drag the scale bar with your mouse to the desired location. Click the scale bar text with your mouse to toggle between horizontal and vertical scale bars.
Use the toolbar to take actions on the current image. Toolbar controls include:

Select between raw data and projection segmentation images

Adjust image controls

View all images in this experiment in a Contact Sheet Viewer

Synchronize all other section image viewers on the page that support synchronization to the currently selected image

Close the Section Images viewer
Use the keyboard to navigate through the image series and synchronize the viewers on the page. Keyboard commands include:
You can also use the arrow keys to pan the current image.
The Composite Projection Viewer allows you to see several projection experiments overlaid on the reference brain. This view allows you to sync experimental images with the reference atlas and other reference data.

The elements of this viewer include:

The composite view illustrates each selected experiment in an arbitrary color as circles based on the signal density in that voxel. Navigate the image viewer using the onscreen navigation tools or the options in the toolbar.


Choose your orientation - coronal, sagittal or horizontal

Change the size of the circle (0-3 Ergs)

Move through the sections with the slider bar (microns)

Sync composite image to the reference data

See selected experiments in the Brain Explorer 3-D Viewer
The contact sheet viewer shows serial sections of the selected experiment. Background fluorescence in the red channel illustrates basic anatomy and structures of the brain, and the injection site and projections are shown in the green channel.


The High Resolution Image Viewer is launched from the contact sheet display or from clicking the icon in the Section Images Viewer and allows you a closer look at the image data.
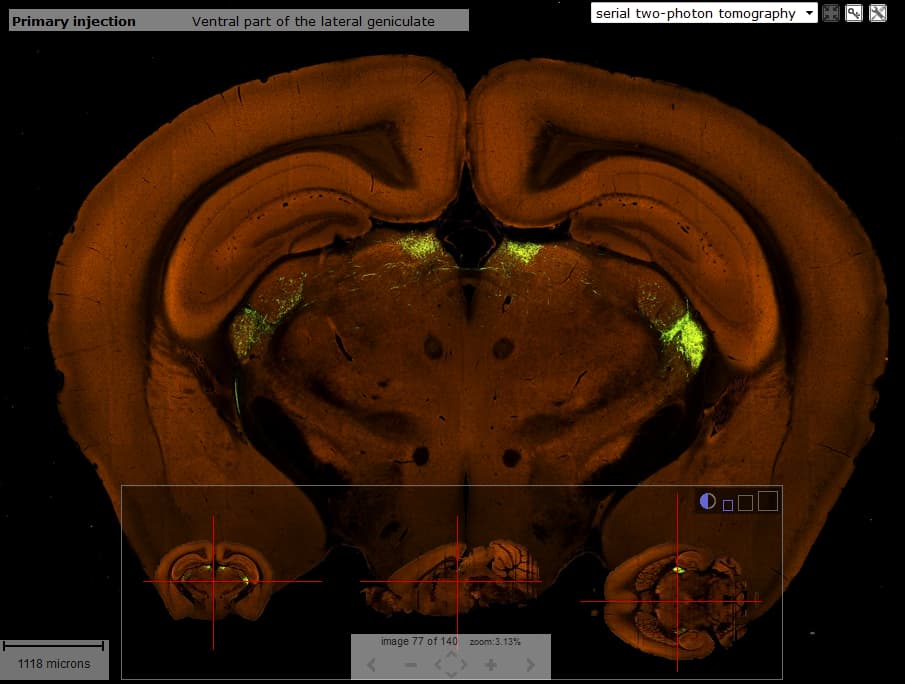
The High Resolution Image Viewer consists of the main image viewer, a scale bar, and a multi-planar viewer. The primary injection site is listed in the title bar in the image viewer. The multi-planar viewer shows the three orthogonal views of the fluorescent projection; the coronal sections generated by two-photon tomography, and the sagittal and horizontal planes that were reconstructed from the coronal sections. Cross-hairs indicate the current location in the main viewer. Navigation of the main coronal image is via clicking on the planar views or by using the keyboard commands.
In the title bar are icons that allow you to interact with the main viewer.

A dropdown menu to view projection or segmentation images

Clicking on this icon will bring up a side by side synced view of the Interactive Atlas Viewer

Clicking on this icon will open a drop-down menu where you can; download an image, adjust the image controls, remove the title bar or remove the multiplanar viewer

The multiplanar viewer can be enlarged by clicking on the 3 varied sized boxes in the top-right corner of the viewer. Clicking on the circle in this toolbar toggles the transparency of the multiplanar viewer so that you can see the image in the main viewer behind the multiplanar viewer or not.
In the High Resolution Image Viewer, use the keyboard commands to navigate through the image series to keep desired zoom and pan selections activated. Keyboard commands include:
You can also use the arrow keys to pan the current image.
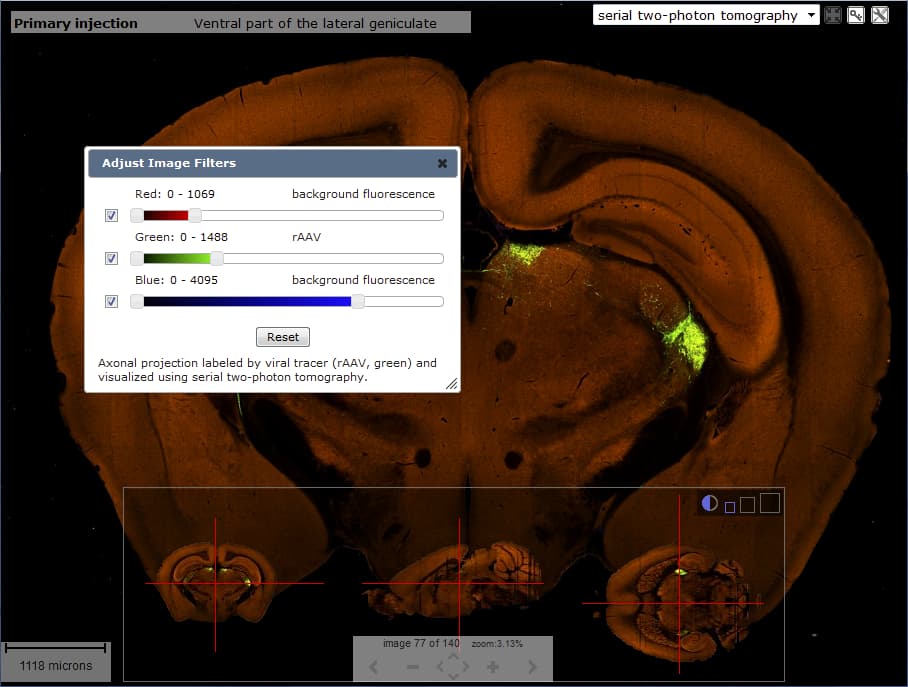
When the “Color Adjustment…” is chosen from the tool icon drop-down menu, you will be presented with a window that allows you to adjust the dynamic range of each channel with a slider bar. What each color represents is outlined above each slider bar and you can exclude any of the channels by unchecking the box next to the slider bar. Once you have adjusted the properties of any channel, you can reset to the default settings by pressing the ‘Reset’ button.

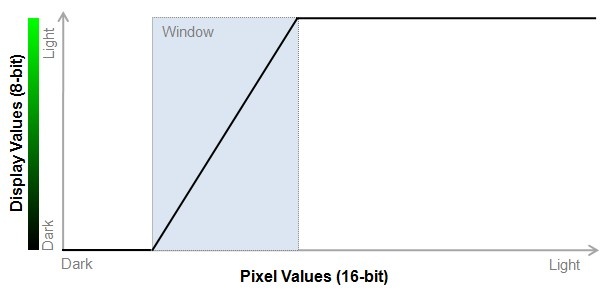
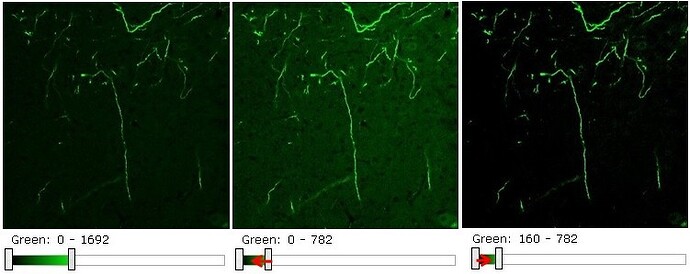
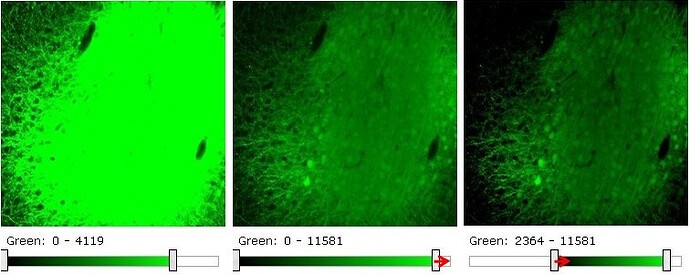
Each serial two-photon tomography image is stored as a three channel Red-Green-Blue (RGB) image with 16-bit per channel resolution. Since web browsers only support 8-bit viewing, we use intensity windowing to compress 16-bit data to 8-bit data. All pixel values below the specified minimum are displayed as black, pixel values above the specified maximum are displayed as green (or red/ blue depending on the channel). The pixel values in between are linearly stretched over the 8-bit range.

To make an image appear brighter, move the window sliders to the left, to make an image darker move the window sliders to the right. To increase contrast, move the sliders towards each other, to decrease contrast move the sliders away from each other.
The image below gives an example of how to brighten an image to enhance low intensity projections.

This next example shows how to darken and increase contrast of an image to look at details at the injection site. Note: turning on the blue channel may increase the resolution of individual cell-bodies at the site of infection.

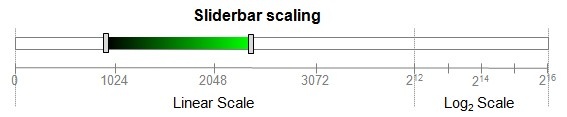
Note: the first three-quarters of the slider-bar represents the lower (0,4095) pixel value range in linear scale. The last quarter of the slider-bar represents the remaining upper (4096, 65535) range in log2 scale. The dual scaling allows for a compact representation of the full range, while allowing for fine-scale control at the lower end.

Learn about API Allen Brain Connectivity Atlas with comprehensive guides and examples from Allen Institute for Brain Science.
The primary data of the Allen Mouse Brain Connectivity Atlas consists of high-resolution images of axonal projections targeting different anatomic regions or various cell types using Cre-dependent specimens. Each data set is processed through an informatics data analysis pipeline to obtain spatially mapped quantified projection information.
From the API, you can:

Download Images

Download quantified projection values by structure

Download quantified projection values as 3-D grids

Query the source, target, spatial and correlative search services

Query the image synchronization service

Download atlas images, drawings and structure ontology
This document provides a brief overview of the data, database organization and example queries. API database object names are in camel case. See the main API documentation for more information on data models and query syntax.
Experimental data from the Atlas is associated with the “Mouse Connectivity Projection” Product.
Each Specimen is injected with a viral tracer that labels axons by expressing a fluorescent protein. For each experiment, the injection site is analyzed and assigned a primary injection structure and, if applicable, a list of secondary injection structures.
Labeled axons are visualized using serial two-photon tomography. A typical SectionDataSet consists of 140 coronal images at 100 µm sampling density. Each image has 0.35 µm pixel resolution and raw data is in 16-bit per channel format. Background fluorescence in the red channel illustrates basic anatomy and structures of the brain, and the injection site and projections are shown in the green channel. No data was collected in the blue channel.
From the API, detailed information about SectionDataSets, SectionImages, Injections and TransgenicLines can be obtained using RMA queries.

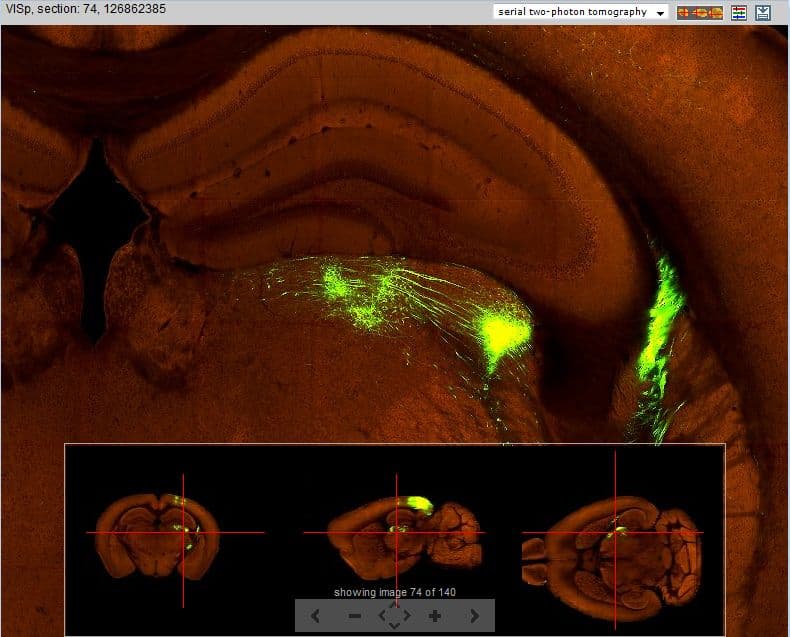
Figure: Projection dataset (id=126862385) with injection in the primary visual area (VISp) as visualized in the web application image viewer.
To provide a uniform look over all experiments, default window and level values were computed using intensity histograms. For each experiment, the upper threshold defaults to (2.33 x the 95th percentile value) for the red channel and (6.33 x the 95th percentile value) for the green channel. The default threshold can be used to download images and/or image region in 8-bit per channel image format.
In the web application, images from the experiment are visualized in an experimental detail page. All displayed information, images and structural projection values are also available through the API.

The informatics data processing pipeline produces results that enable navigation, analysis and visualization of the data. The pipeline consists of the following components:
The output of the pipeline is quantified projection values at a grid voxel level and at a structure level according to the integrated reference atlas ontology. The grid level data are used downstream to provide a correlative search service and to support visualization of spatial relationships. See the informatics processing white paper for more details.
The cornerstone of the automated pipeline is an annotated 3-D reference space. For this purpose, a next generation of the common coordinate framework (CCF v3) is being created based on an average population of 1675 specimens. See the Allen Mouse Common Coordinate Framework whitepaper for detailed construction information. In this current release, the framework consists of 207 newly drawn structures spanning approximately half the brain. To support whole brain quantification, structures which have not yet been drawn are extracted and merged from the version 2 framework based on the Allen Reference Atlas. The interfaces between old and new structures were manually inspected and filled to create smooth transitions to create a complete brain map (~700 structures) for quantification.

Structures in the common coordinate framework are arranged in a hierarchical organization. Each structure has one parent and denotes a “part-of” relationship. Structures are assigned a color to visually emphasize their hierarchical positions in the brain.
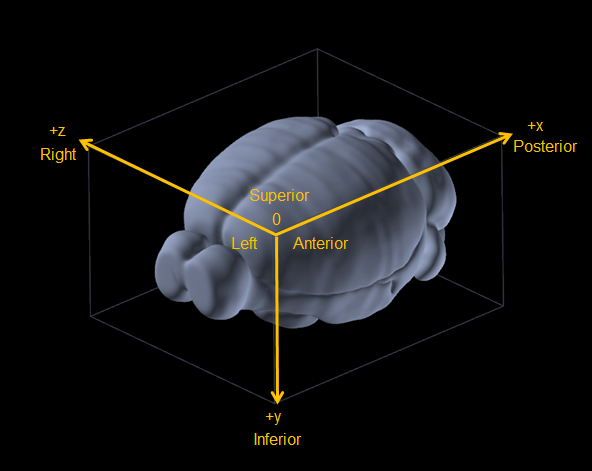
All SectionDataSets are registered to ReferenceSpace id = 9 in PIR orientation (+x = posterior, +y = inferior, +z = right).

3-D annotation volumes were updated in the October 2017 release to include newly drawn structures in the Allen Mouse Common Coordinate Framework (CCFv3).
Volumetric data files available download:
Each data type is available in multiple voxel resolutions:
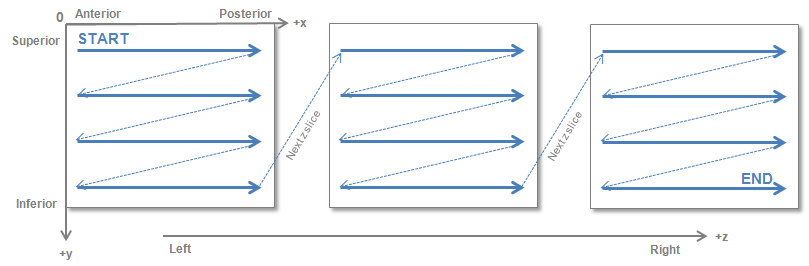
All volumetric data is compressed NRRD (Nearly Raw Raster Data) format. The raw numerical data is stored as a 1-D array raster as shown in the figure below.

Example Matlab code snippet to read in the 25µm template and annotation volumes:
% -------------------------------
%% Download a NRRD reader
% For example:
% http://www.mathworks.com/matlabcentral/fileexchange/50830-nrrd-format-file-reader
%
% Requires: MATLAB 7.13 (R2011b)
%
% Download:
% average_template_25.nrrd
% ara_nissl_25.nrrd
% ccf_2015/annotation_25.nrrd
% -------------------------------
%% Read image volume with NRRD reader
% Note: reader swaps the order of the first two axes
%
% AVGT = 3-D matrix of average_template
% NISSL = 3-D matrix of ara_nissl
% ANO = 3-D matrix of ccf_2015/annotation
[AVGT, metaAVGT] = nrrdread('average_template_25.nrrd');
[NISSL, metaNISSL] = nrrdread('ara_nissl_25.nrrd');
[ANO, metaANO] = nrrdread('annotation_25.nrrd');
%% Display one coronal section
figure;
imagesc(squeeze(AVGT(:, 264, :)));
colormap(gray(256));
axis equal;
figure;
imagesc(squeeze(NISSL(:, 264, :)));
colormap(gray(256));
axis equal;
figure;
imagesc(squeeze(ANO(:, 264, :)));
caxis([1, 2000]);
colormap(lines(256));
axis equal;
%% Display one sagittal section
figure;
imagesc(squeeze(AVGT(:, :, 220)));
colormap(gray(256));
axis equal;
figure;
imagesc(squeeze(NISSL(:, :, 220)));
colormap(gray(256));
axis equal;
figure;
imagesc(squeeze(ANO(:, :, 220)));
caxis([1, 2000]);
colormap(lines(256));
axis equal;
Example Python code snippet to read in the 25µm template and annotation volumes:
# -------------------------------
# Install pynrrd:
# https://github.com/mhe/pynrrd
#
# Download:
# average_template_25.nrrd
# ara_nissl_25.nrrd
# ccf_2015/annotation_25.nrrd
# -------------------------------
import nrrd
import numpy as np
import matplotlib.pyplot as plt
from PIL import Image
# ---------------------------------
# Read image volume with NRRD reader
# Note: reader swaps the order of the first two axes
#
# AVGT = 3-D matrix of average_template
# NISSL = 3-D matrix of ara_nissl
# ANO = 3-D matrix of ccf_2015/annotation
# ---------------------------------
AVGT, metaAVGT = nrrd.read('average_template_25.nrrd')
NISSL, metaNISSL = nrrd.read('ara_nissl_25.nrrd')
ANO, metaANO = nrrd.read('annotation_25.nrrd')
# ---------------------------------
# Save one coronal section as PNG
# ---------------------------------
slice = AVGT[264, :, :].astype(float)
slice /= np.max(slice)
im = Image.fromarray(np.uint8(plt.cm.gray(slice) * 255))
im.save('output/avgt_coronal.png')
slice = NISSL[264, :, :].astype(float)
slice /= np.max(slice)
im = Image.fromarray(np.uint8(plt.cm.gray(slice) * 255))
im.save('output/nissl_coronal.png')
slice = ANO[264, :, :].astype(float)
slice /= 2000
im = Image.fromarray(np.uint8(plt.cm.jet(slice) * 255))
im.save('output/ano_coronal.png')
# ---------------------------------
# Save one sagittal section as PNG
# ---------------------------------
slice = AVGT[:, :, 220].astype(float)
slice /= np.max(slice)
im = Image.fromarray(np.uint8(plt.cm.gray(slice) * 255))
im.save('output/avgt_sagittal.png')
slice = NISSL[:, :, 220].astype(float)
slice /= np.max(slice)
im = Image.fromarray(np.uint8(plt.cm.gray(slice) * 255))
im.save('output/nissl_sagittal.png')
slice = ANO[:, :, 220].astype(float)
slice /= 2000
im = Image.fromarray(np.uint8(plt.cm.jet(slice) * 255))
im.save('output/ano_sagittal.png')
The aim of image alignment is to establish a mapping from each SectionImage to the 3-D reference space. The module reconstructs a 3-D Specimen volume from its constituent SectionImages and registers the volume to the 3-D reference model by maximizing mutual information between the red channel of the experimental data and the average template.
Once registration is achieved, information from the 3-D reference model can be transferred to the reconstructed Specimen and vice versa. The resulting transform information is stored in the database. Each SectionImage has an Alignment2d object that represents the 2-D affine transform between an image pixel position and a location in the Specimen volume. Each SectionDataSet has an Alignment3d object that represents the 3-D affine transform between a location in the Specimen volume and a point in the 3-D reference model. Spatial correspondence between any two SectionDataSets from different Specimens can be established by composing these transforms.
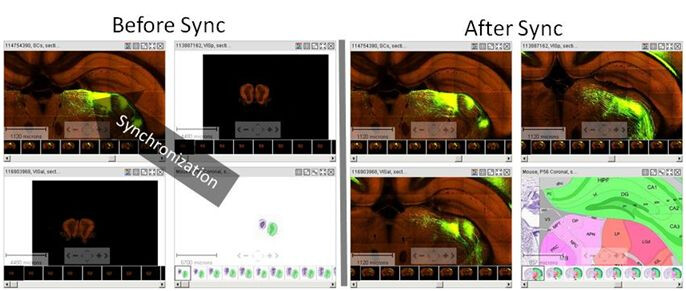
For convenience, a set of “Image Sync” API methods is available to find corresponding positions between SectionDataSets, the 3-D reference model and structures. Note that all locations on SectionImages are reported in pixel coordinates and all locations in 3-D ReferenceSpaces are reported in microns. These methods are used by the Web application to provide the image synchronization feature in the multiple image viewer (see Figure).

For every Projection image, a grayscale mask is generated that identifies pixels corresponding to labeled axon trajectories. The segmentation algorithm is based on image edge/line detection and morphological filtering.
The segmentation mask image is the same size and pixel resolution as the primary projection image and can be downloaded through the image download service.

The red, green, and blue channels have been aligned to the 25um adult mouse brain reference space volume. These volumes have been stored in the API WellKnownFile table with type name “ImagesResampledTo25MicronARA”. To retrieve the download link for a specific data set, query for WellKnownFiles of the appropriate type with an “attachable_id” equal to the data set id:
http://api.brain-map.org/api/v2/data/WellKnownFile/query.xml?criteria=well_known_file_type[name$eq’ImagesResampledTo25MicronARA’][attachable_id$eq156198187]
Download this by attaching the value of the download-link field to the API web host name (http://api.brain-map.org/api/v2/well_known_file_download/269830017). The download file will be a .zip file containing three images stored in the raw meta image format:
All volumes have the same dimensions as the 25um adult mouse reference space volume.
For each dataset, the gridding module creates a low resolution 3-D summary of the labeled axonal trajectories and resamples the data to the common coordinate space of the 3-D reference model. Casting all data into a canonical space allows for easy cross-comparison between datasets. The projection data grids can also be viewed directly as 3-D volumes or used for analysis (i.e. target, spatial and correlative searches).
Each image in a dataset is divided into a 10 x 10 µm grid. In each division, the sum of the number of detected pixels and the sum of detected pixel intensity were collected. A second set of these same summations was computed for the regions manually identified as belonging to the injection site for injection site quantification. The resulting 3-D grid is then transformed into the standard reference space using linear interpolation to generate sub-grid values.
From the summations we obtained measures for:
For each summation type, grid files can be downloaded at 10, 25, 50 and 100 μm isotropic voxel resolution.
3-D grids were updated in the May 2015 release to reflect the remapping to the new Allen Mouse Common Coordinate Framework (CCFv3), higher resolution computation and a new compress data format. 3-D grids from the October 2014 release (mapped to CCFv2) can be accessed through our data download server (see instructions).
Grid data for each SectionDataSet can be downloaded using the 3-D Grid Data Service. The service returns a compressed NRRD (Nearly Raw Raster Data) 32-bit FLOAT format. To download a particular grid file, the user specifies the SectionDataSet ID, the type of grid and the resolution.
Examples:
http://api.brain-map.org/grid_data/download_file/287495026??image=projection_density&resolution=50
Example Matlab code snippet to read in the 50 µm projection_density grid volume and average_template:
% -------------------------------
%
% Download a NRRD reader
% For example:
% http: //www.mathworks.com/matlabcentral/fileexchange/50830-nrrd-format-file-reader
%
% Requires: MATLAB 7.13 (R2011b)
%
% Download average_template_50.nrrd
% Download projection_density at 50 micron for SectionDataSet id = 287495026
%
% ---------------------------------
%
% Read image volume with NRRD reader
% Note that reader swaps the order of the first two axes
%
% AVGT = 3 -D matrix of average_template
% PDENS = 3 -D matrix of projection_density
% DMASK = 3 -D matrix of data_mask
%
[AVGT, metaAVGT] = nrrdread( 'average_template_50.nrrd' );
[PDENS, metaPDENS] = nrrdread( '11_wks_coronal_287495026_50um_projection_density.nrrd' );
[DMASK, metaDMASK] = nrrdread( '11_wks_coronal_287495026_50um_data_mask.nrrd' );
% Display one coronal section
figure;imagesc(squeeze(AVGT(:, 184 ,:)));colormap(gray( 256 )); axis equal;
figure;imagesc(squeeze(PDENS(:, 184 ,:)));colormap(jet( 256 )); axis equal;
figure;imagesc(squeeze(DMASK(:, 184 ,:)));colormap(gray( 256 )); axis equal;
Example Python code snippet to read in the 50 µm injection_density and injection_fraction and compute an injection centroid:
# -------------------------------
#
# Install pynrrd: https: //github.com/mhe/pynrrd
#
# Download injection_density at 50 micron for SectionDataSet id = 287495026
# Download injection_fraction at 50 micron for SectionDataSet id = 287495026
#
# ---------------------------------
import nrrd
import numpy as np
import matplotlib.pyplot as plt
import Image
#
# Read image volume with NRRD reader
# Note that reader swaps the order of the first two axes
#
# INJDENS = 3 -D matrix of injection_density
# INJFRAC = 3 -D matrix of injection_fraction
#
INJDENS, metaINJDENS = nrrd.read( '11_wks_coronal_287495026_50um_projection_density.nrrd' );
INJFRAC, metaINJFRAC = nrrd.read( '11_wks_coronal_287495026_50um_injection_fraction.nrrd' );
# find all voxels with injection_fraction >= 1
injection_voxels = np.where( INJFRAC >= 1 )
injection_density = INJDENS[injection_voxels]
sum_density = sum(injection_density)
# compute centroid in CCF coordinates
centroid = map( lambda x : sum( injection_density * x ) / sum_density * 50 , injection_voxels)
print centroid
Projection signal statistics can be computed for each structure delineated in the reference atlas by combining or unionizing grid voxels with the same 3-D structural label. While the reference atlas is typically annotated at the lowest level of the ontology tree, statistics at upper level structures can be obtained by combining measurements of the hierarchical children to obtain statistics for the parent structure. The unionization process also separates out the left versus right hemisphere contributions as well as the injection versus non-injection components.
Projection statistics are encapsulated as a ProjectionStructureUnionize object associated with one Structure, either left, right or both Hemispheres and one SectionDataSet. ProjectionStructureUnionize can be downloaded via RMA. ProjectionStructureUnionize data is used in the web application to display projection summary bar graphs.
Examples:
http://api.brain-map.org/api/v2/data/ProjectionStructureUnionize/query.xml?criteria=[section_data_set_id$eq126862385], [is_injection$eqfalse]&num_rows=5000&include=structure
http://api.brain-map.org/api/v2/data/ProjectionStructureUnionize/query.xml?criteria=[section_data_set_id$eq126862385], [is_injection$eqtrue]&num_rows=5000&include=structure
A projection grid service has been implemented to allow users to instantly search over the whole dataset to find experiments with specific projection profiles.
To perform a Source Search, a user specifies a set of source structures. The service returns all experiments for which either the primary injection structure or one of its secondary injection structures corresponding to one of the specified source structures or their descendents in the ontology. The search results can also be filtered by a list of transgenic lines.
See the connected service page for definitions of service::mouse_connectivity_injection_structure parameters.
The output of the source search is a xml list of objects. Each object represents one experiment and contains information about the experiment including its unique identifier, the primary injection structure, list of any secondary injection structures, injection coordinates, injection volume and transgenic line name.
Examples:
http://api.brain-map.org/api/v2/data/query.json?criteria= service::mouse_connectivity_injection_structure[injection_structures$eqIsocortex][primary_structure_only$eqtrue]
http://api.brain-map.org/api/v2/data/query.json?criteria= service::mouse_connectivity_injection_structure[injection_structures$eqIsocortex][transgenic_lines$eq0][primary_structure_only$eqtrue]
http://api.brain-map.org/api/v2/data/query.json?criteria= service::mouse_connectivity_injection_structure[injection_structures$eqIsocortex][transgenic_lines$eq’Syt6-Cre_KI148’][primary_structure_only$eqtrue]

To perform a Target Search, the user specifies a set of target structures. The service returns a rank list of experiments by signal volume in the target structures which are above a minimum threshold. The target structure specification can be further refined by hemisphere. The search results can also be filtered by a list of source structures and/or list of transgenic lines.
See the connected service page for definitions of service::mouse_connectivity_injection_structure parameters.
The output of the target search is a xml list of objects. Each object represents one experiment and contains information about the experiment including its unique identifier, the primary injection structure, list of any secondary injection structures, injection coordinates, injection volume and transgenic line name. Additionally, the total signal volume and number of voxels spanned by the target structure(s) is also reported.
Example:
http://api.brain-map.org/api/v2/data/query.json?criteria= service::mouse_connectivity_injection_structure[injection_structures$eqIsocortex][primary_structure_only$eqtrue][target_domain$eqLGd]

To perform a Spatial Search, a user selects a target location within the 3D reference space. The service returns a rank list of experiments by signal density in the target location and with density greater than 0.1.
See the connected service page for definitions of service::mouse_connectivity_target_spatial parameters.
The output of the target search is a xml list of objects. Each object represents one experiment and contains information about the experiment including its unique identifier, the primary injection structure, list of any secondary injection structures, injection coordinates, injection volume and transgenic line name. Additionally, the path from the target location to the injection site is listed along with signal density at each node.
Example:
http://api.brain-map.org/api/v2/data/query.xml?criteria= service::mouse_connectivity_target_spatial[seed_point$eq6900,5050,6450]

To perform an Injection Coordinate Search, a user specifies a seed location within the 3D reference space. The service returns a rank list of experiments by distance of its injection site to the specified seed location.
See the connected service page for definitions of service::mouse_connectivity_injection_coordinate parameters.
The output of the injection coordinate search is a xml list of objects. Each object represents one experiment and contains information about the experiment including its unique identifier, the primary injection structure, list of any secondary injection structures, injection coordinates, injection volume and transgenic line name. Additionally, distance between the injection site and seed location is also reported.
Example: Injection coordinate search for experiments with a seed location in VM (ventral medial nucleus of the thalamus)
http://api.brain-map.org/api/v2/data/query.xml?criteria= service::mouse_connectivity_injection_coordinate[seed_point$eq6900,5050,6450]
To perform a Correlation Search, the user selects a seed experiment and a domain over which the similarity comparison is to be made. All voxels belonging to any of the domain structures form the domain voxel set. Pearson’s correlation coefficient is computed between the domain voxel set from the seed experiment and every other experiment in the product. The return list is sorted by descending correlation coefficient.
See the connected service page for definitions of service::service::mouse_connectivity_correlation parameters.
The output of the injection coordinate search is a xml list of objects. Each object represents one experiment and contains information about the experiment including its unique identifier, the primary injection structure, list of any secondary injection structures, injection coordinates, injection volume and transgenic line name. Additionally, the Pearson’s correlation coefficient between the experiment and the seed is reported.
Example:
http://api.brain-map.org/api/v2/data/query.xml?criteria= service::mouse_connectivity_correlation[row$eq112670853][structures$eqTH]

Learn about Transgenic Characterization with comprehensive guides and examples from Allen Institute for Brain Science.
From this tab you can browse and select from reporter lines and driver lines used in the creation of the Allen Mouse Brain Connectivity Atlas.
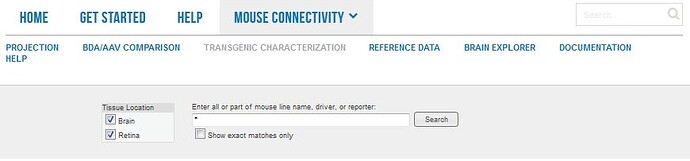
Search the Transgenic Mouse dataset by entering a gene symbol or mouse line name into the search box. Retinal Projectome data includes four experiments with vertical mount sections of the retina. You will be prompted with suggestions once you have started typing. Click “Search” or hit the Enter key.

You can also browse through the data using tabs on the search page that illustrate all of the Driver Lines and Reporter Lines used in this resource.
Each driver line is represented by its name, a representative image (which is magnified when clicked) and a description of expression. Clicking on the line name will return results from all characterization experiments for that particular line.

This tab lists all the characterized reporter lines with a description of their expression patterns.
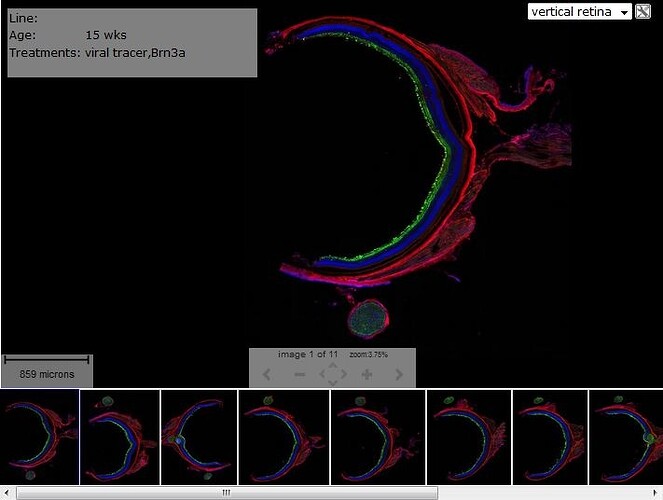
Representative retinas were sectioned in the vertical plane for characterization of morphology and co-localization with markers for well defined retinal ganglion cell (RGC) types. Four markers were used:
Each experiment shows the GFP viral tracer infection in green, the marker in red and a DAPI stain in blue.

Clicking on Search will return a list of experiments based on your search criteria with information on the Experiment ID, Line Name, Driver, Reporter, Probes, Age, Sex, Treatments and Image Count. Click on the Experiment ID to be taken to the Experiment Detail Page
To compare multiple experiments, mark the checkboxes to the left of each row, then click the “Compare Selected Experiments” button. Note: the selection list may contain previously selected experiments from the “Projection” or “BDA/AAV” studies. Your choices are stored in a browser ‘cookie’ on your computer and will remain in effect until you click the “Clear Selections” button, or clear your Web browser cookie cache.
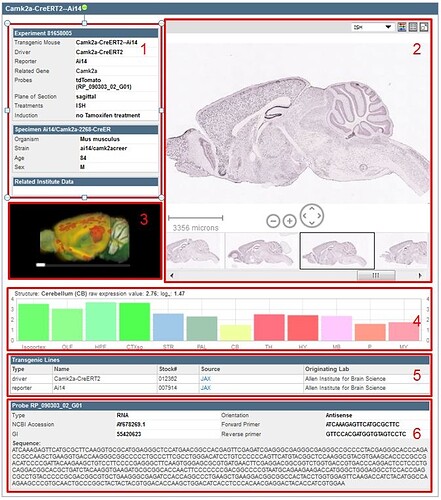
Clicking on the experiment summary link returns a summary of the experimental details (see screenshot).

The various sections of the experimental detail page are outlined 1-6 as follows:
The Zoom and Pan (ZAP) Image Viewer is a powerful tool to navigate and view the images in an experiment. The main part of the viewer is an interactive window where an image can be repositioned by dragging with a mouse. Use the scroll wheel, on-screen navigation buttons or the keyboard commands to zoom in or out.
Select other images in the experiment by clicking on a thumbnail image below the main viewer.


Drag the scale bar with your mouse to the desired location. Click the scale bar text with your mouse to toggle between horizontal and vertical.
Use the toolbar to take actions on the image that currently has focus. Toolbar controls include:

Select ISH, Nissl or Expression Energy

Image adjust controls

Display all thumbnail images in a single contact sheet

Open the selected image in the High Resolution Image Viewer
Use the keyboard to navigate through the image series and synchronize the viewers on the page. Keyboard commands include:
You can also use the arrow keys to pan the current image.
The expression mask image display highlights those cells that have the highest probability of gene expression using a heat map color scale (from low/blue to high/red).

The Expression Energy was calculated as follows: Within a given area A (voxel or structure), expression energy = (sum of intensity of expressing pixels in A) / (sum of all pixels in A):