

Cell Types & Taxonomies
The Allen Institute for Brain Science has created several datasets aimed at defining and characterizing the kinds of cells present in the mammalian brain, across multiple brain regions, species, and stages of life. These data-driven classifications, called taxonomies, provide organizing principles for studying brain structure and function.

Explore Cell Types Data
Cell type taxonomies, underlying datasets, and associated tools for exploration of gene expression, electrophysiology, and morphology of brain cell types are included below.


Additional Resources
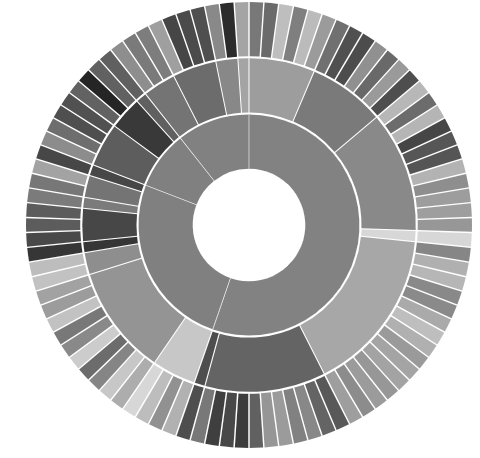
An interactive cellular taxonomy visualization representing diversity in the mouse primary visual cortex allows you to browse this landscape, based on gene expression at the single cell level, using data from over 1,600 cells. This visualization will guide you through the data and insights from this study and explains how a cell type taxonomy is built.
The Transcriptomics Explorer is a tool for visualization and analysis of large-scale single-cell or single nucleus RNA-Seq data and associated cell type annotation. This tool likely wil not be updated, but key features are being transitioned into the ABC Atlas. Five taxonomies in human and mouse forebrain are available for exploration, including three listed here.
The RNA-Seq Data Navigator application was developed in 2018 to explore transcriptomic data in mouse primary visual cortex (VISp) and anterior lateral motor cortex (ALM), as well as human middle temporal gyrus (MTG).
In addition to MapMyCells, we provide a suite of R-based tools for mapping data to cell type taxonomies, as well as instances of Allen Institute Taxonomies that can be referenced via Aziumth, a mapping tool developed by HuBMAP.
Cytosplore Viewer is a downloadable application that allows exploration of single cell RNA-Seq and spatial transcriptomics data from the Allen Cell Types Database and from associated Allen Institute and BICCN publications. Cytosplore was developed by a team from the Leiden Computational Biology Center, the Division of Image Processing at the Leiden University Medical Center, and the Computer Graphics and Visualization Group at the TU Delft in collaboration with the Allen Institute.