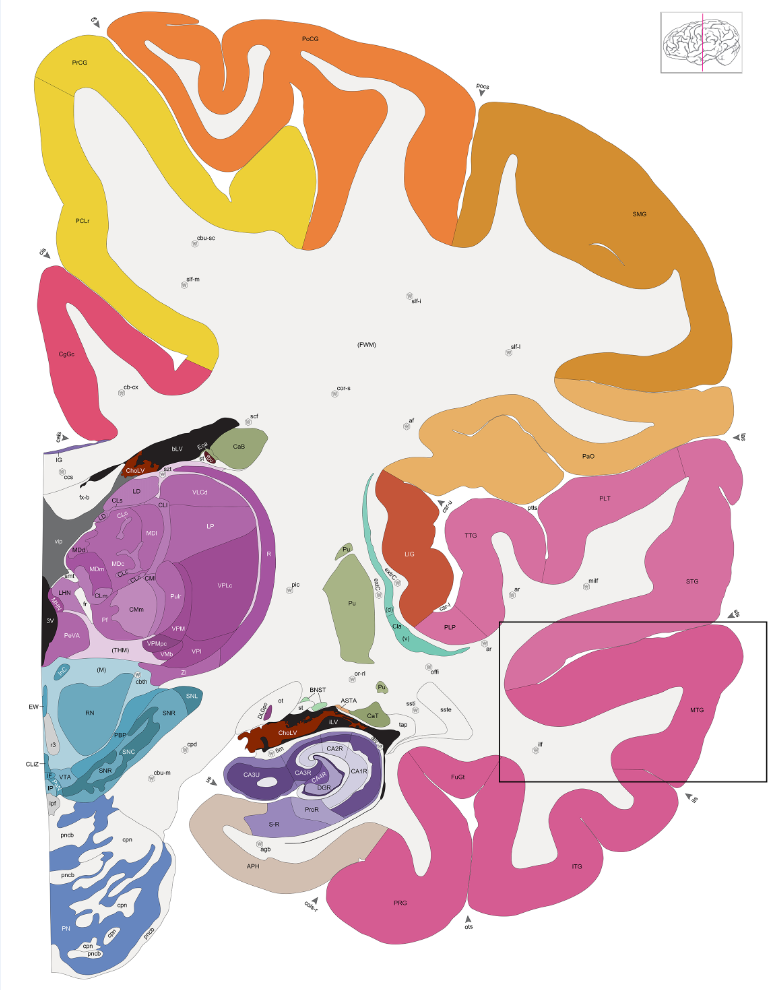
This study used single-nucleus RNA sequencing to systematically survey cells across the entire adult human brain. We sampled more than three million nuclei from approximately 100 dissections across the forebrain, midbrain, and hindbrain in three postmortem donors. Our analysis identified 461 clusters and 3313 subclusters organized largely according to developmental origins and revealing high diversity in midbrain and hindbrain neurons. This work provides the most comprehensive census of cells in adult human brain to date.
Taxonomy Name: 202210140_BICCN-Adult_Human_WholeBrain_10X
Taxonomy Description: Whole Human Brain Taxonomy
Species: Human
Version: 1.0.0
CCN Number: CCN202210140
AIT Number: 106
Learn more about the project and download the data
Transcriptomic diversity of cell types across the adult human brain
Explore the data in the ABC Atlas
Label your data using the whole human brain taxonomy as a reference
Explore the data using CELLXGENE

Taxonomy of human middle temporal gyrus generated with SMART-seq data in 2019
This data set includes single-nucleus transcriptomes from 15,928 total nuclei derived from both frozen and neurosurgical human brain specimens, to survey cell type diversity in the human middle temporal gyrus (MTG). Nuclei from 8 human tissue donors ranging in age from 24-66 years were analyzed, revealing 75 transcriptionally distinct cell types: 45 inhibitory neuron types, 24 excitatory neuron types, and 6 non-neuronal types. Note: these data were included in the subsequent “Human Multiple Cortical Areas - SMART-seq” data set
Taxonomy Name: 20190821_Adult_Human_MTG_SMARTseq
Taxonomy Description: Human MTG SMART-Seq Taxonomy
Species: Human
Version: 1.1.0
CCN Number: CCN201908210
AIT Number: 15.3
Learn more about the project and download the data
Download the taxonomy Allen Institute Taxonomy (AIT) file in .h5ad format from AWS s3
Conserved cell types with divergent features in human versus mouse cortex
Explore the data using the RNA-Seq Data Navigator
Explore the data using the UCSC Genome Browser

This study used single cell transcriptomics and performed cellular characterization of eight areas in human neocortex to better understand cortical areal specialization.
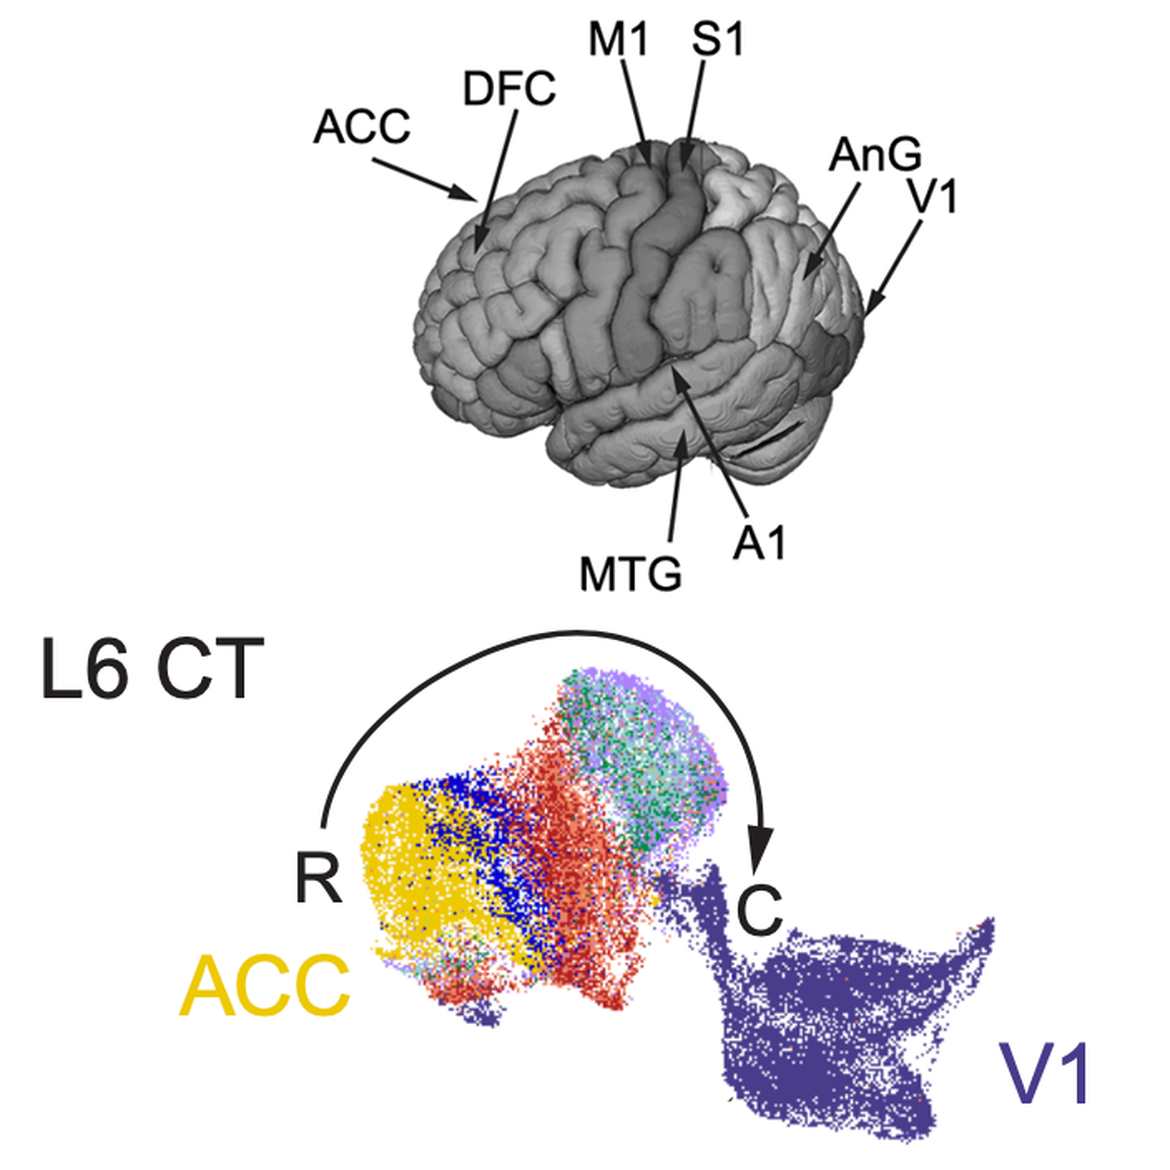
This study used single cell transcriptomics and performed cellular characterization of eight areas in human neocortex to better understand cortical areal specialization. This work identified 24 highly consistent cell subclasses across structures. However, proportions of excitatory neuron subclasses varied substantially, and some glia showed distinct layer organization across areas. Primary visual cortex showed characteristic organization with major changes both excitatory and inhibitory types, reflecting the importance of vision for humans.
Taxonomy Name: 20191012_Adult_Human_Neocortex_SMARTseq
Taxonomy Description: Multiple Cortical Areas - SMART-seq
Species: Human
Version: 1.0.0
CCN Number: CCN201910121
AIT Number: 105.0
Download the taxonomy as Allen Institute Taxonomy (AIT) file in .h5ad format from AWS s3
Transcriptomic cytoarchitecture reveals principles of human neocortex organization
Explore the data using CELLXGENE

A taxonomy of the human middle temporal gyrus developed as part of the Seattle Alzheimer's Disease Brain Cell Atlas
This study used single cell and spatial genomics tools alongside quantitative neuropathology to understand the impact of Alzheimer's disease progression on cell types in middle temporal gyrus and dorsolateral prefrontal cortex. We mapped >1.2 million cells per region from 84 aged donors to 125 transcriptional types and showed which cell types changed in their abundance and gene expression with increasing disease pathology. This manuscript accompanies a freely available public resource to explore these data and to accelerate progress in AD research at SEA-AD.org.
Taxonomy Name: 20230505_SEAAD-Adult_Human_MTG_10X
Taxonomy Description: MTG - 10x SEA-AD
Species: Human
Version: 1.0.0
CCN Number: CCN20230505
AIT Number: 31
Learn more about the project and download the data
Integrated multimodal cell atlas of Alzheimer’s disease
Explore the single-nucleus transcriptomics data
Explore the spatial transcriptomics data
Label your data using the human MTG taxonomy as a reference
Explore the data using the Transcriptomics Explorer