Alzheimer's Disease Resources (SEA-AD)
Overview
SEA-AD provides several resources allowing users to actively explore donor metadata, neuropathology, and cell type-specific gene expression, chromatin accessibility, and spatial localization in a cohort of donors with varying disease-associated pathologies. This page summarizes the available resources by data type, with each section summarizing why each data type is important, the kinds of questions that can be answered using the resources, and links to/brief summaries of each resource.
Examples of questions addressed by these resources include:
- In which cell types is gene X expressed?
- How does gene X change with disease in different cell types?
- What kind of cells do I have in my own omics data set?
- What is the spatial relationship between cell type X and cell type Y in AD?
- How does AD pathology look in the brains of donors with or without dementia?
- How do cell types from SEA-AD compare with cell types defined in younger donors and other cohorts?
Know your data type but not your resource—jump to the relevant section below:
Single Nucleus Transcriptomics
Why single-nucleus transcriptomics data?
- Create a foundational high resolution cell type reference atlas, akin to the human genome, to understand the molecular underpinnings of Alzheimer’s disease at the cell type level.
- More than one million nuclei align to over 100 cell types in each cortical area assayed.
- Consistent cell types identified across multiple studies of AD.
Questions you can asking with these data & tools
- What cell types are found in the adult and aged brains?
- In which cells types is gene X expressed?
- Are genes X and Y co-expressed in the same cell type?
- How does gene X change with disease in different cell types?
- Which genes are most selectively expressed in a particular cell type or disease state?
- What kind of cells do I have in my own omics data set?

Transcriptomics Comparative Viewer
- Compare gene expression in cells from neurotypical and aged brains side by side for any gene
- Overlay and quantification of expression differences in the context of donor demographics and disease metrics
- Tissue assayed: middle temporal gyrus from all donors
Transcriptomics Explorer
- Visualize gene expression levels in human cortical cell types using a heatmap or a UMAP
- Tissue assayed: middle temporal gyrus from younger neurotypical donors
- These data form the basis for defining cell types in the SEA-AD aged donor cohort
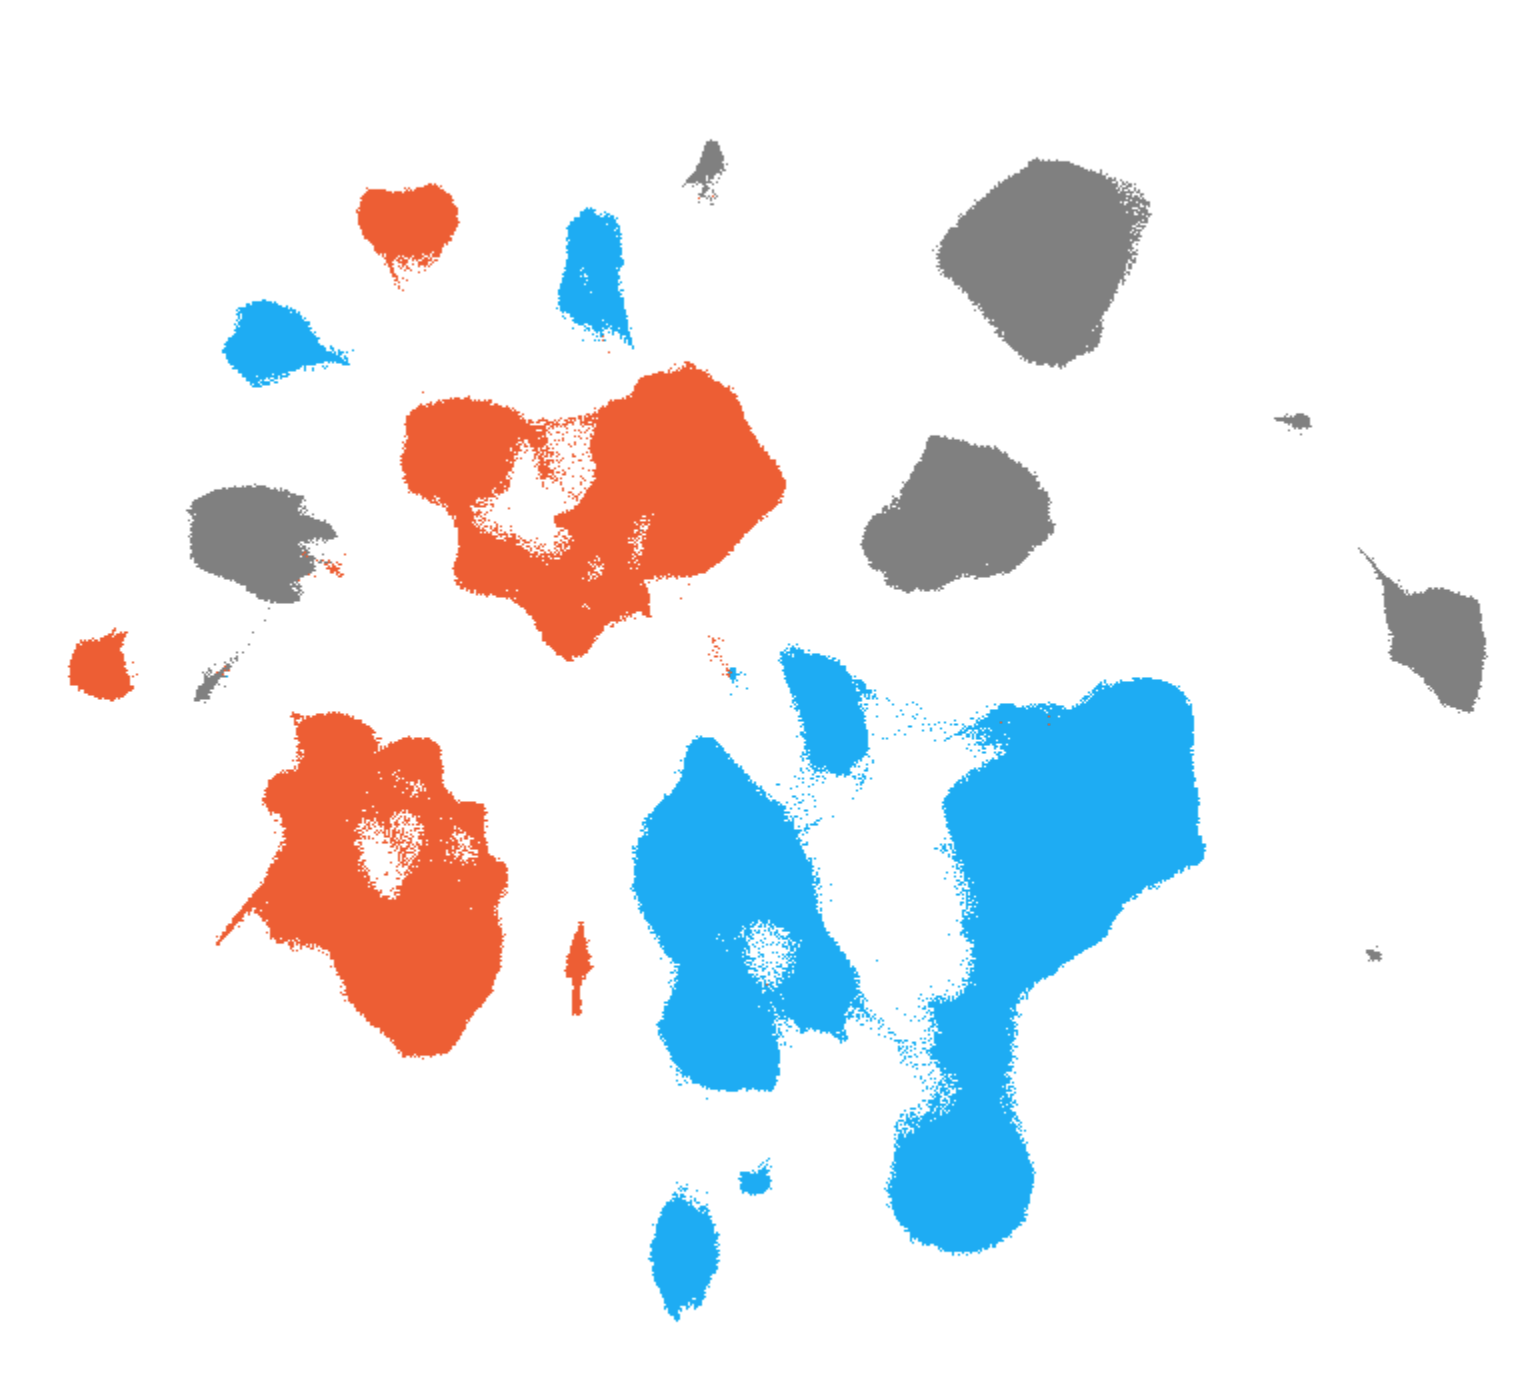
Allen Brain Cell (ABC) Atlas: Single Nucleus RNA-Seq
- Explore gene expression levels in human cortical cells in the context of donor demographics and disease metadata using a UMAP
- Tissue assayed: middle temporal gyrus and A9 (prefrontal cortex) from all donors
- All 2.78 million nuclei are organized into a joint taxonomy to allow exploration of gene expression in the context of cell types and donor metrics
- NEW: Explore an additional ~6 million cells from nine additional brain regions from neocortex, allocortex, and caudate nucleus.
- NEW: Access and visualize the data sets programmatically via ABC Atlas Access.
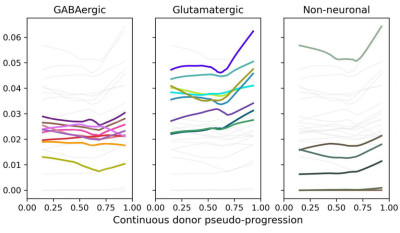
Gene Expression Trajectory Viewer
- Identify and visualize cell type-specific gene expression changes across AD pseudo-progression at multiple taxonomic levels
- Tissue assayed: middle temporal gyrus from aged donors
- The viewer depends on two key pieces of information: Quantitative neuropathology and gene expression - learn more in Gene Expression Trajectory Viewer's Overview

MapMyCells
- Assign SEA-AD cell types to your own single-cell/nucleus transcriptomics data
- This application uses vetted, state-of-the-art mapping algorithms to compare your own data to SEA-AD cell type taxonomies
- Tissue assayed: middle temporal gyrus from all donors
- NEW: map to the multi-region cell type taxonomy derived from ten neocortical and allocortical regions.

Chan Zuckerberg CELLXGENE
- Perform on-the-fly analysis and visualization of gene expression and metadata from SEA-AD data sets
- Tissue assayed: datasets spanning the full taxonomy and individual subclasses in both middle temporal gyrus and A9 (prefrontal cortex)
- Note this will take you to an external website: Chan Zuckerberg Initiative's CELLxGENE
Spatial Transcriptomics
Why spatial transcriptomics data?
- Builds off the single nucleus transcriptomics data by defining the anatomical context for cell types.
- Helps address questions on how the brain-wide transcriptomics landscape of cell types relates to the anatomical and circuit organization and its ontology rooted in development and evolution.
- Spatial analyses demonstrated the co-localization of vulnerable cell populations largely in supragranular cortical layers.
Questions you can ask using these data & tools
- Where is gene X expressed in the MTG?
- What is the spatial relationship between cell type X and cell type Y?
- How does the abundance of cell type X change over the progression of AD?
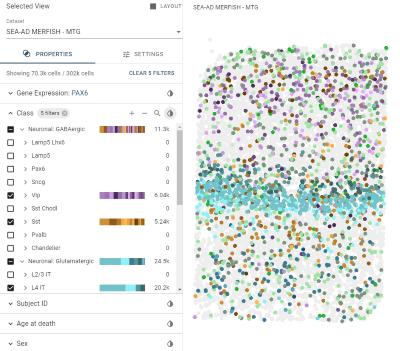
Allen Brain Cell (ABC) Atlas: Spatial Transcriptomics
- Explore cell type co-localization and gene expression in the largest cell-resolution MERFISH data set in AD human brain to date (302k cells)
- Tissue assayed: middle temporal gyrus from 24 aged donors (subset of the 84 SEA-AD cohort)
- Based on a 140 gene panel created to define neuronal types in MTG
Donors and Neuropathology
Data and specimens were obtained from the Adult Changes in Thought (ACT) Study from Kaiser Permanente Washington Health Research Institute (KPWHRI), and the University of Washington Alzheimer’s Disease Research Center (ADRC).
Questions you can ask using these data & tools:
- What types of neuropathology are found in the aged and AD brain?
- How does AD pathology look in the brains of donors with or without dementia?
- How do amyloid, tau, and other pathologies co-occur across donors and brain regions?
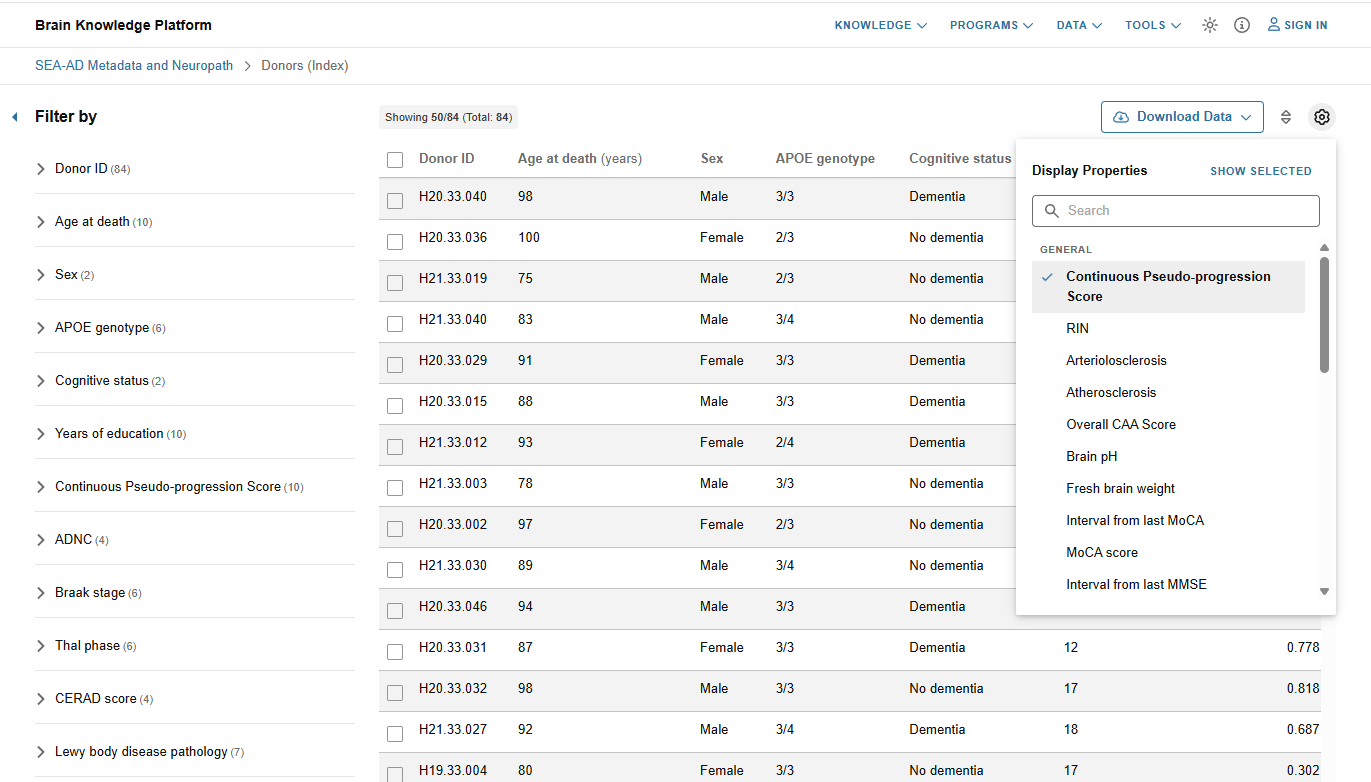
SEA-AD Donor Index
- Review demographic, clinical, cognitive, and neuropathological information from the SEA-AD cohort
- Click on the gear icon to view more metadata
- Filter donors by various metadata
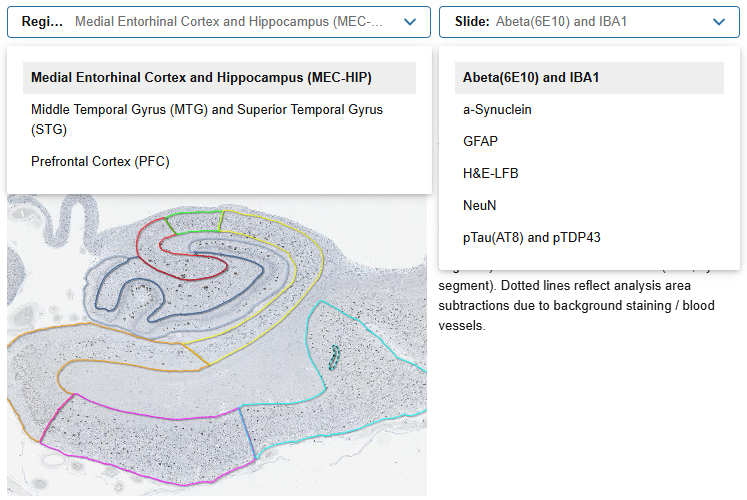
Neuropathology Image Viewer
- Examine images of donor brain tissue sections from multiple brain regions stained for key pathological proteins and cell types of interest to Alzheimer’s disease
- Tissue assayed: middle temporal gyrus, superior temporal gyrus, medial entorhinal cortex, hippocampus, prefrontal cortex
- Neuropathology from all donors can accessed via the Donor Index
- NEW: Also view data from primary visual cortex and extrastriate occipital cortex.
Knowledge Integration
SEA-AD aims to build a detailed map of brain cell types in aging and AD. This map will help us understand how the disease affects different cell populations and brain regions. To achieve this, SEA-AD is using advanced techniques to analyze brain tissue samples from carefully selected individuals with varying degrees of AD pathology. These approaches include:
- Next-generation single-cell molecular profiling technologies developed through the BRAIN Initiative Cell Census/Atlas Network (BICAN/BICCN) and at the Allen Institute for Brain Science.
- Application of spatial transcriptomic methods to Alzheimer's-affected tissue sections to define the spatial distribution of vulnerable cell types and reveal the impact on the structural and functional organization of tissue and circuit microarchitecture.
- Integrating single-cell profiling technologies with quantitative neuropathology and deep clinical phenotyping via collaboration with the University of Washington Alzheimer's Disease Research Center (ADRC) and Kaiser Permanente Washington Health Research Institute (KPWHRI).
Outputs of SEA-AD include manuscripts summarizing scientific findings, modified reference cell type taxonomies, and tools, data, and resources for exploration of our work that are freely available to the AD community.
Annotation Comparison Explorer (ACE)
- Compare cell type annotations between SEA-AD and ten community studies of AD or user data from MapMyCells
- Brain regions included: prefrontal cortex of aged/AD donors in each study
- More generally, this application can compare two or more annotations such as cell type assignments, donor information, and cell metadata across multiple of the Allen Institute's cell type data sets or in user-provided data
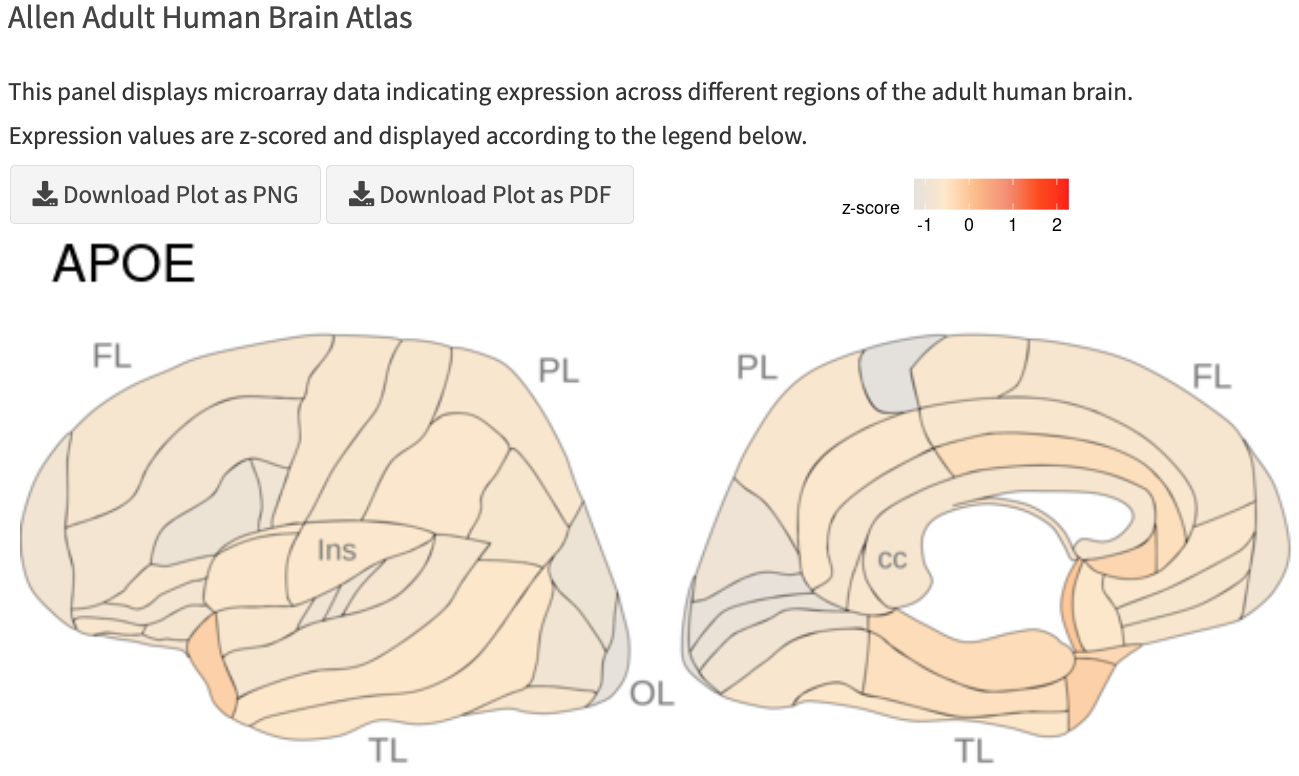
Gene Knowledge Cards
- Highlight patterns of gene expression in the brain and identify other genes that are related in their expression
- Integrates data from the Allen Institute’s public single-cell transcriptomics datasets and historical atlases at the level of individual genes.
- Note that this application may be slow to load as it draws data from a significant number of sources
Epigenomics: Chromatin Accessibility
Single nucleus ATAC-seq data provides access to the chromatin landscape of SEA-AD donors in health and disease, providing insights into which genes are available to be read and used to make proteins, and whether accessibility is gained or lost in AD.
Questions you can ask using these data & tools
- Where in the genome is chromatin selectively accessible in cell type X?
- Where in the genome does chromatin accessibility change in donors with high vs. low AD pathology?
- In what cell types does my known enhancer X have open chromatin?
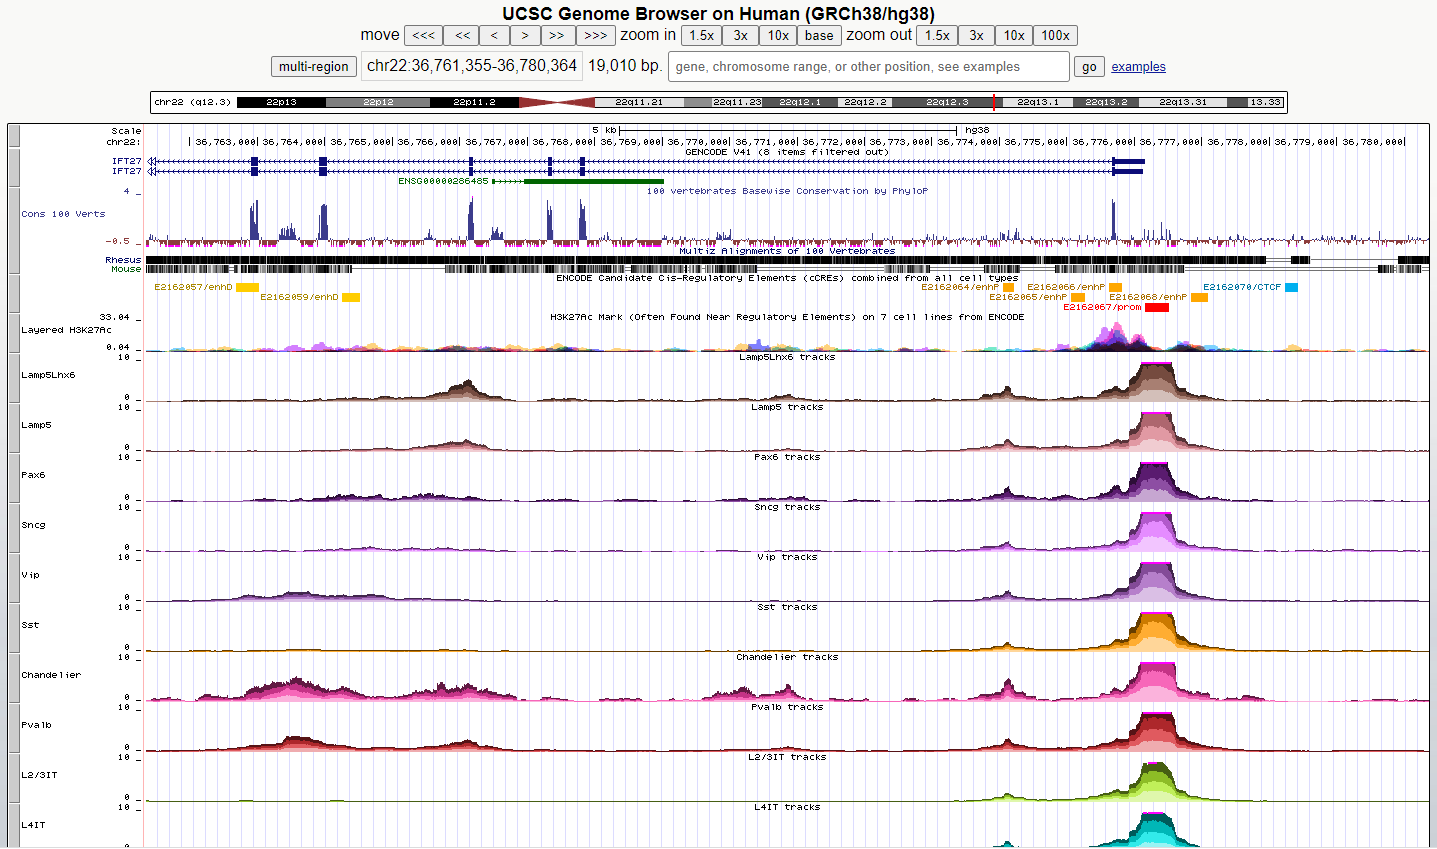
UCSC Genome Browser
- Explore the open chromatin landscape and assess changes in chromatin accessibilit using single nucleus ATAC-seq data
- Tissue assayed: Middle Temporal Gyrus (MTG) and A9 (Prefrontal Cortex, PFC)
- Note: this will take you external website, UCSC Genome Browser
Whole Genome Sequencing (WGS)
Whole Genome Sequencing (WGS) and Single Nucleotide Polymorphism (SNP) array data provide direct access to differences in the genetic code between SEA-AD (and other) individuals. Such differences directly impact disease risk and potential response to treatment and relate to variation in cell type-specific gene expression and chromatin accessibility between individuals.
Questions you can ask using these data
- Which SEA-AD donors have known genetic risk factors for AD and how do these factors relate to molecular changes?
- Which genomic locations impact expression of specific genes globally or in specific cell types?
The National Institute on Aging Genetics of Alzheimer’s Disease Data Storage Site (NIAGADS) Data Sharing Service repository
- Explore Whole Genome Sequencing (WGS) and genotyping SNP array data for the SEA-AD donor cohort
- Tissue assayed: A9 (prefrontal cortex)
- Note this will take you to an external site: The National Institute on Aging Genetics of Alzheimer’s Disease Data Storage Site (NIAGADS) Data Sharing Service repository


Explore our Programs
The Allen Institute for Brain Science is active in a wide variety of areas to accelerate progress towards understanding the brain. Find choice resources below.